Include and use fields from additional list in Org Chart (SharePoint Server 2019/SE)
In this tip, I will show you how to include and use fields from another list in your Org Chart structure.
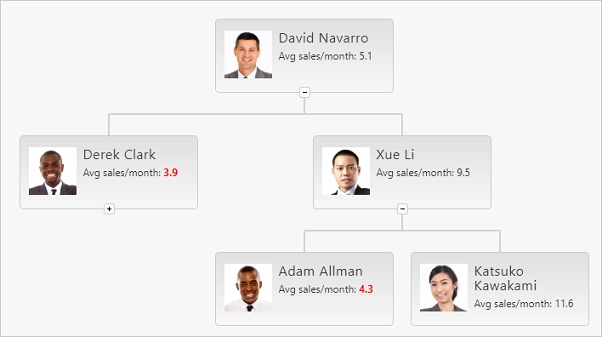
For example, you may add the information about average sales per month for all employees and mark by red color and set the bold weight for a value if an employee has less than 5 sales. Please take a look at the picture below:
For that you need to open the configuration wizard and switch to Custom JavaScript step:
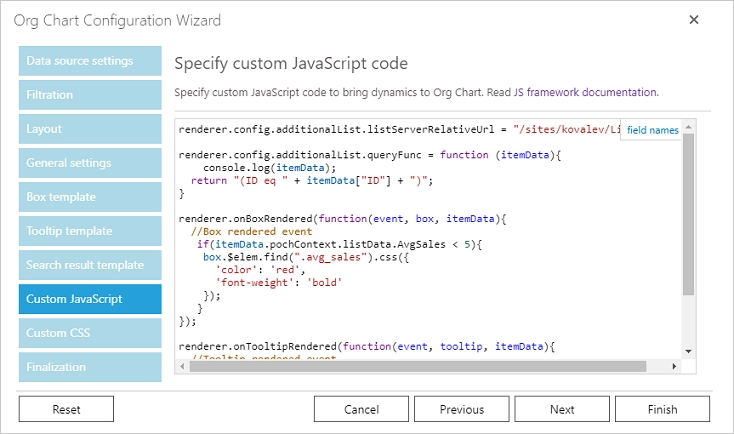
And add one of the code samples below. For the SharePoint list data source:
renderer.config.additionalList.listServerRelativeUrl = "/sites/kovalev/Lists/AddList";
renderer.config.additionalList.queryFunc = function (itemData) {
  return "(ID eq " + itemData["ID"] + ")";
}
For the User profiles data source:
renderer.config.additionalList.listServerRelativeUrl = "/sites/kovalev/Lists/AddList";
renderer.config.additionalList.queryFunc = function (itemData) {
  var accountName = renderer.dataProvider._idResolver.trimUserProfileId(itemData["AccountName"]);
  return "(Account eq '" + accountName + "')";
}
IDandAccountare columns in the additional list used for correlation with the main data source.renderer.config.additionalList.listServerRelativeUrl– a server-relative URL of your additional list. Properties of items from this list will be added to items in OrgChart structure.renderer.config.additionalList.queryFunc– a function that will return a rule for the one-on-one relation between an item from the data source list and an item from your additional list. You need to use the syntax of OData filtering for writing this rule.
Now you can use additional properties to implement additional logic into your OrgChart structure.
In my case, I need to add the additional property with average sales to the box template. For that, I chose Box template step of the configuration wizard, switched to HTML mode and added the token that will be replaced by a value of the property from the additional list:
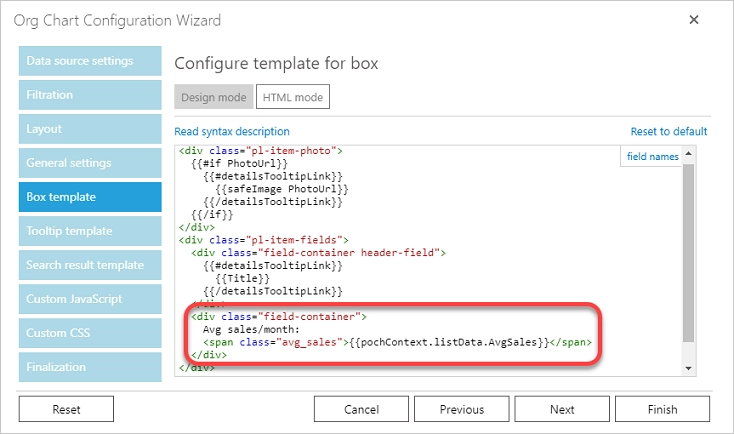
As you can see on the picture, I used this token: {{pochContext.listData.AvgSales}} (where AvgSales is internal name of AvgSales field in the additional list).
Note
All properties of the item from the additional list will contained in pochContext.listData variable.
After these steps I will see the average value inside an employee box. And all I need to do it is just set the color of the value and change the font weight if an employee has less than 5 sales.
For that, I changed onBoxRendered event on Custom JavaScript step like this:
renderer.onBoxRendered(function(event, box, itemData){
  //Box rendered event
  if(itemData.pochContext.listData.AvgSales < 5){
    box.$elem.find(".avg_sales").css({
      'color': 'red',
      'font-weight': 'bold'
    });
  }
});
That is all! Now you know how to add properties of the item from another list to properties of the item from data source list.