Demos for PPTX templates
Company Report
This demo demonstrates how to create a presentation for an simple report. Scroll down to see source data for the template in JSON format.
Template |
Result |
|---|---|

|

|
Template data
{
        "title": "Plumsail monthly report",
        "subtitle": "made by David Navarro",
        "date": "Today",
        "state": "On track",
        "action": [
                {
                        "description": "Hire more experts"
                },
                {
                        "description": "Remove obstacles"
                },
                {
                        "description": "Marketing"
                },
                {
                        "description": "..."
                },
                {
                        "description": "Profit!!!"
                }
        ],
        "sales": [
                {
                        "country": "Romania",
                        "lead": "Count Drakula",
                        "churn": 50,
                    "new": 220
                },
                {
                        "country": "USA",
                        "lead": "John Doe",
                        "churn": 450,
                        "new": 1500
                },
                {
                        "country": "Australia",
                        "lead": "Jacky Coala",
                        "churn": 0,
                        "new": 3060
                },
                {
                        "country": "Japan",
                        "lead": "Naruto",
                        "churn": 260,
                        "new": 820
                }
        ],
        "history": [
                {
                        "period": "2018/Q1",
                        "total": 5030
                },
                {
                        "period": "2018/Q2",
                        "total": 5050
                },
                {
                        "period": "2018/Q3",
                        "total": 6120
                },
                {
                        "period": "2018/Q4",
                        "total": 6650
                },
                {
                        "period": "2019/Q1",
                        "total": 7660
                },
                {
                        "period": "2019/Q2",
                        "total": 7540
                },
                {
                        "period": "2019/Q3",
                        "total": 8220
                }
        ]
}
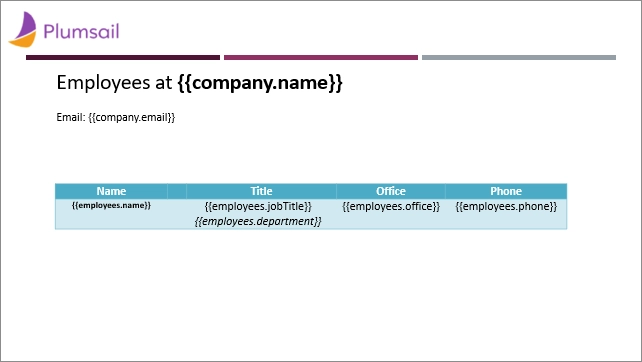
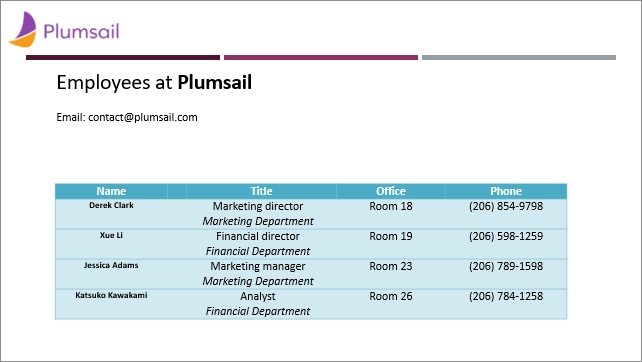
Regular table
This demo shows how to create a table based on an array of objects. You can find the description of this case in the tables documentation.
Scroll down to see source data for the template in JSON format.
Template |
Result |
|---|---|
|
|
Template data
{
  "company": {
    "name": "Plumsail",
    "email": "contact@plumsail.com"
  },
  "employees": [
    {
      "name": "Derek Clark",
      "jobTitle": "Marketing director",
      "department": "Marketing Department",
      "office": "Room 18",
      "phone": "(206) 854-9798"
    },
    {
      "name": "Xue Li",
      "jobTitle": "Financial director",
      "department": "Financial Department",
      "office": "Room 19",
      "phone": "(206) 598-1259"
    },
    {
      "name": "Jessica Adams",
      "jobTitle": "Marketing manager",
      "department": "Marketing Department",
      "office": "Room 23",
      "phone": "(206) 789-1598"
    },
    {
      "name": "Katsuko Kawakami",
      "jobTitle": "Analyst",
      "department": "Financial Department",
      "office": "Room 26",
      "phone": "(206) 784-1258"
    }
  ]
}
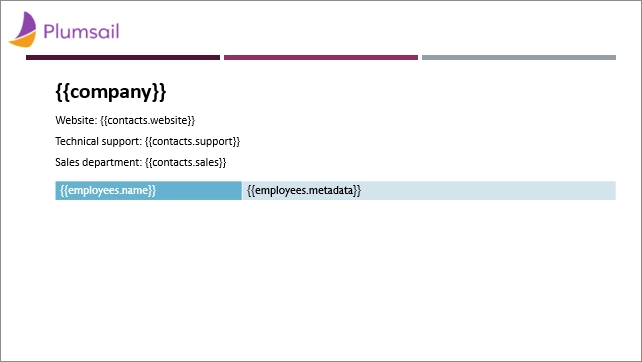
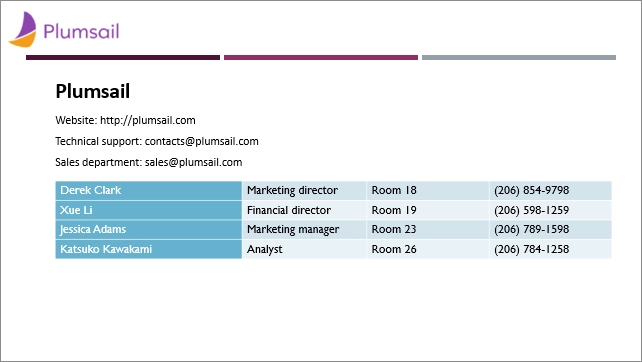
Dynamic table columns
This demo shows how to render multiple table columns using an array of objects in your data source. You can find the description of this case in the tables documentation.
Scroll down to see source data for the template in JSON format.
Template |
Result |
|---|---|
|
|
Template data
{
  "company": "Plumsail",
  "contacts": {
    "website": "http://plumsail.com",
    "support": "contacts@plumsail.com",
    "sales": "sales@plumsail.com"
  },
  "employees": [
    {
      "name": "Derek Clark",
      "metadata": [
        [
          "Marketing director",
          "Room 18",
          "(206) 854-9798"
        ]
      ]
    },
    {
      "name": "Xue Li",
      "metadata": [
        [
          "Financial director",
          "Room 19",
          "(206) 598-1259"
        ]
      ]
    },
    {
      "name": "Jessica Adams",
      "metadata": [
        [
          "Marketing manager",
          "Room 23",
          "(206) 789-1598"
        ]
      ]
    },
    {
      "name": "Katsuko Kawakami",
      "metadata": [
        [
          "Analyst",
          "Room 26",
          "(206) 784-1258"
        ]
      ]
    }
  ]
}
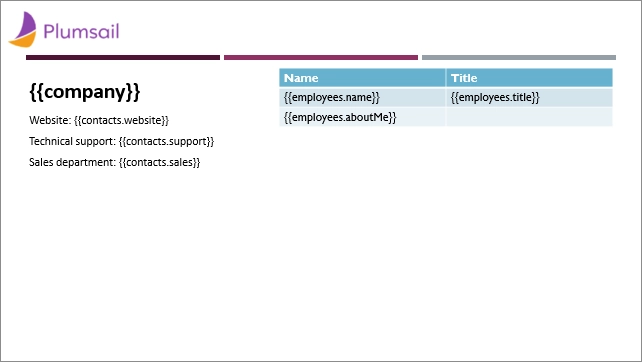
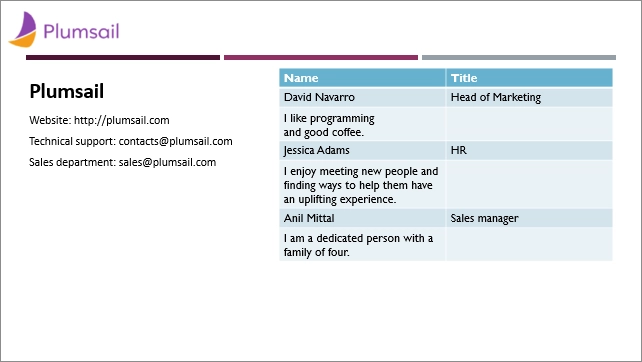
Repeat multiple table rows
This demo shows how to occupy multiple table rows by properties of a single object from your source array. You can find the description of this case in the tables documentation.
Scroll down to see source data for the template in JSON format.
Template |
Result |
|---|---|
|
|
Template data
{
  "company": "Plumsail",
  "contacts": {
    "website": "http://plumsail.com",
    "support": "contacts@plumsail.com",
    "sales": "sales@plumsail.com"
  },
  "employees": [
    {
      "name": "David Navarro",
      "title": "Head of Marketing",
      "aboutMe": "I like programming \nand good coffee."
    },
    {
      "name": "Jessica Adams",
      "title": "HR",
      "aboutMe": "I enjoy meeting new people and finding ways to help them have an uplifting experience."
    },
    {
      "name": "Anil Mittal",
      "title": "Sales manager",
      "aboutMe": "I am a dedicated person with a family of four."
    }
  ]
}
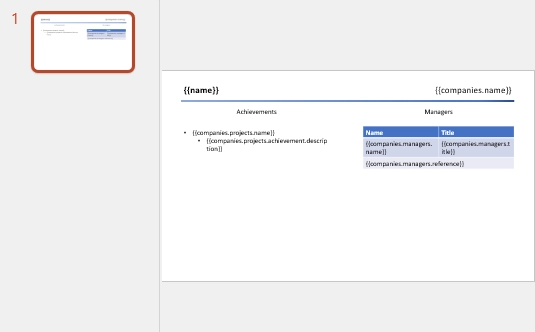
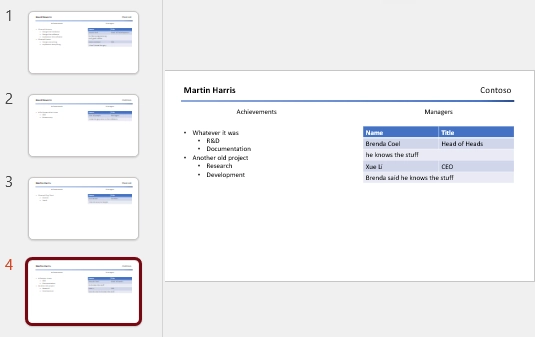
Loops and nesting
This demo shows how to use loops and nesting logic in PowerPoint templates. You can find the description of this case in the loops and nesting section of the documentation.
Scroll down to see source data for the template in JSON format.
Template |
Result |
|---|---|
|
|
Template data
[
    {
        "name": "David Navarro",
        "companies": [
            {
                "name": "Plumsail",
                "projects": [
                    {
                        "name": "Plumsail Actions",
                        "achievement": [
                            {
                                "description": "Design the hardware"
                            },
                            {
                                "description": "Design the software"
                            },
                            {
                                "description": "Implement the software"
                            }
                        ]
                    },
                    {
                        "name": "Plumsail Forms",
                        "achievement": [
                            {
                                "description": "Design everything"
                            },
                            {
                                "description": "Implement everything"
                            }
                        ]
                    }
                ],
                "managers": [
                    {
                        "name": "Derek Clark",
                        "title": "Head of Development",
                        "reference": "he likes programming \nand good coffee"
                    },
                    {
                        "name": "Jessica Adams",
                        "title": "CEO",
                        "reference": "I don't know this guy"
                    }
                ]
            },
            {
                "name": "Contoso",
                "projects": [
                    {
                        "name": "Who knows what it was",
                        "achievement": [
                            {
                                "description": "R&D"
                            },
                            {
                                "description": "Bureaucracy"
                            }
                        ]
                    }
                ],
                "managers": [
                    {
                        "name": "Lots of people",
                        "title": "Managers",
                        "reference": "I saw this guy once in the cafeteria"
                    }
                ]
            }
        ]
    },
    {
        "name": "Martin Harris",
        "companies": [
            {
                "name": "Plumsail",
                "projects": [
                    {
                        "name": "Plumsail Org Chart",
                        "achievement": [
                            {
                                "description": "Mentor"
                            },
                            {
                                "description": "Teach"
                            }
                        ]
                    }
                ],
                "managers": [
                    {
                        "name": "Anil Mittal",
                        "title": "Founder",
                        "reference": "I like the way he laughs"
                    }
                ]
            },
            {
                "name": "Contoso",
                "projects": [
                    {
                        "name": "Whatever it was",
                        "achievement": [
                            {
                                "description": "R&D"
                            },
                            {
                                "description": "Documentation"
                            }
                        ]
                    },
                    {
                        "name": "Another old project",
                        "achievement": [
                            {
                                "description": "Research"
                            },
                            {
                                "description": "Development"
                            }
                        ]
                    }
                ],
                "managers": [
                    {
                        "name": "Brenda Coel",
                        "title": "Head of Heads",
                        "reference": "he knows the stuff"
                    },
                    {
                        "name": "Xue Li",
                        "title": "CEO",
                        "reference": "Brenda said he knows the stuff"
                    }
                ]
            }
        ]
    }
]
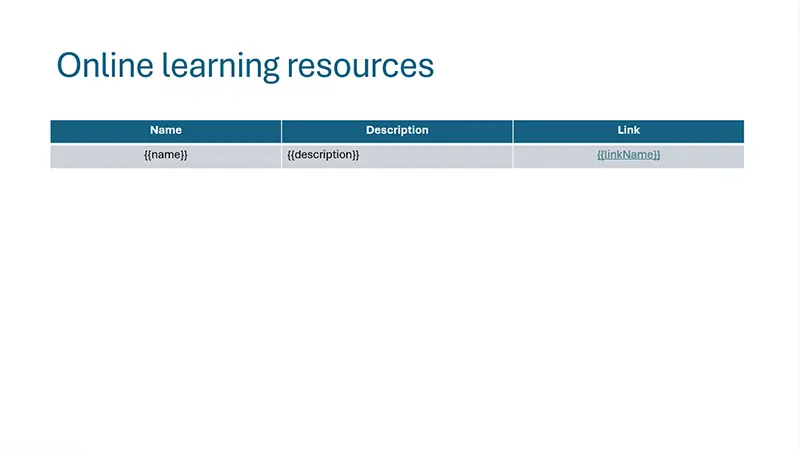
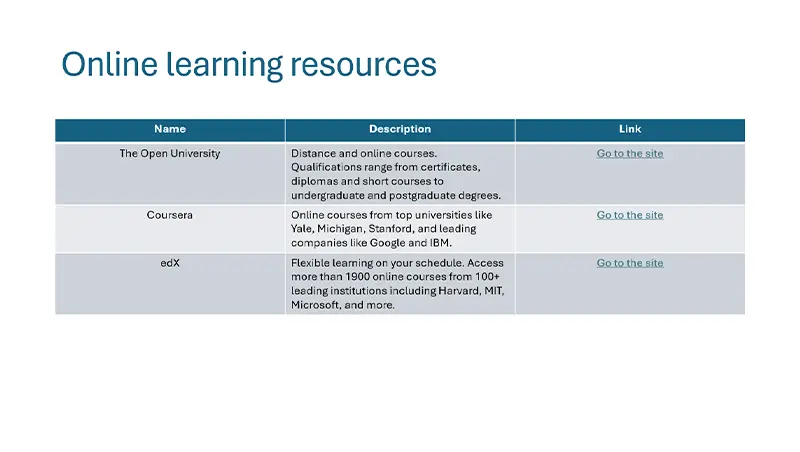
Links
This demo shows how to add external links to your presentation. You can find the description of this case in the links section of the documentation.
Scroll down to see source data for the template in JSON format.
Template |
Result |
|---|---|
|
|
Template data
[
    {
        "name": "The Open University",
        "description": "Distance and online courses. Qualifications range from certificates, diplomas and short courses to undergraduate and postgraduate degrees.",
        "linkName": "Go to the site",
        "linkURL": "http://www.openuniversity.edu/courses"
    },
    {
        "name": "Coursera",
        "description": "Online courses from top universities like Yale, Michigan, Stanford, and leading companies like Google and IBM.",
        "linkName": "Go to the site",
        "linkURL": "https://plato.stanford.edu/"
    },
    {
        "name": "edX",
        "description": "Flexible learning on your schedule. Access more than 1900 online courses from 100+ leading institutions including Harvard, MIT, Microsoft, and more.",
        "linkName": "Go to the site",
        "linkURL": "https://www.edx.org/"
    }
]
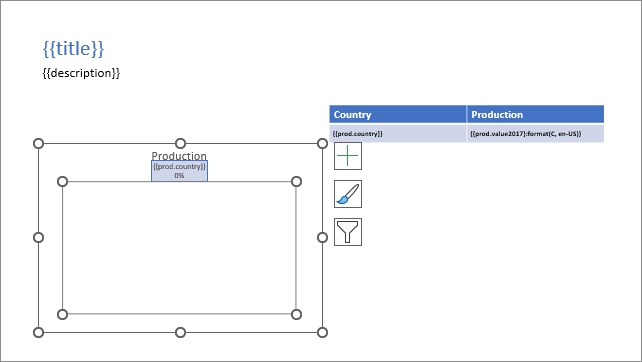
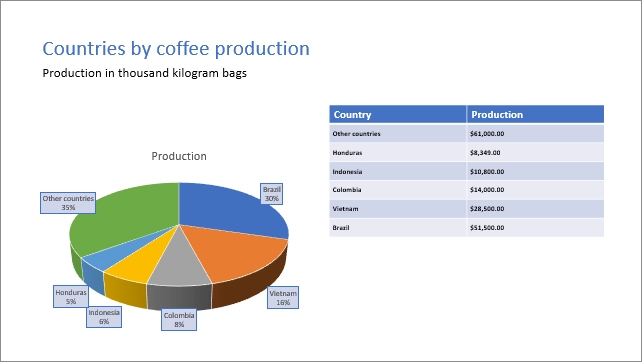
Pie charts
This demo shows how to build a pie chart in a MS Word document. You can find the description of this case in the pie charts documentation.
Scroll down to see source data for the template in JSON format.
Template |
Result |
|---|---|
|
|
Template data
[
    {
        "title": "Countries by coffee production",
        "description": "Production in thousand kilogram bags",
        "prod": [
            {
                "country": "Brazil",
                "value2017": 51500
            },
            {
                "country": "Vietnam",
                "value2017": 28500
            },
            {
                "country": "Colombia",
                "value2017": 14000
            },
            {
                "country": "Indonesia",
                "value2017": 10800
            },
            {
                "country": "Honduras",
                "value2017": 8349
            },
            {
                "country": "Other countries",
                "value2017": 61000
            }
        ]
    }
]
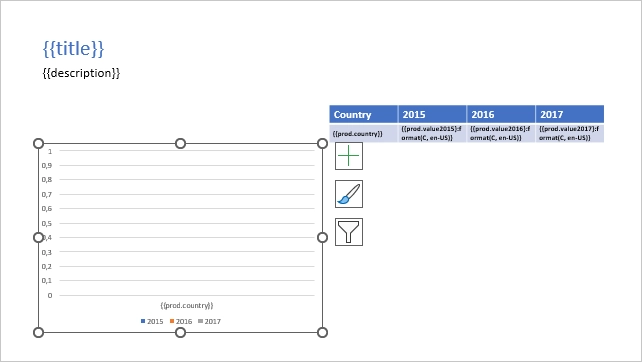
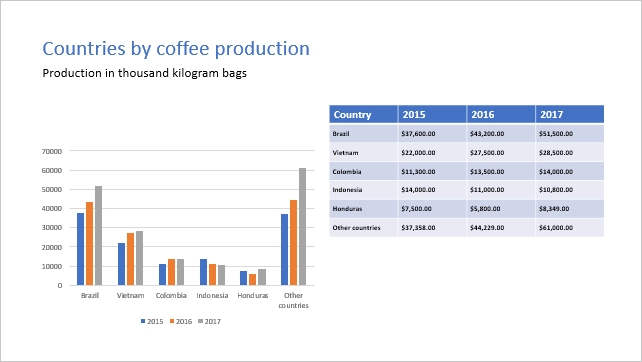
Clustered column charts
This demo shows how to build a clustered column chart in a MS Word document. You can find the description of this case in the clustered column charts documentation.
Scroll down to see source data for the template in JSON format.
Template |
Result |
|---|---|
|
|
Template data
[
    {
        "title": "Countries by coffee production",
        "description": "Production in thousand kilogram bags",
        "prod": [
            {
                "country": "Brazil",
                "value2015": 37600,
                "value2016": 43200,
                "value2017": 51500
            },
            {
                "country": "Vietnam",
                "value2015": 22000,
                "value2016": 27500,
                "value2017": 28500
            },
            {
                "country": "Colombia",
                "value2015": 11300,
                "value2016": 13500,
                "value2017": 14000
            },
            {
                "country": "Indonesia",
                "value2015": 14000,
                "value2016": 11000,
                "value2017": 10800
            },
            {
                "country": "Honduras",
                "value2015": 7500,
                "value2016": 5800,
                "value2017": 8349
            },
            {
                "country": "Other countries",
                "value2015": 37358,
                "value2016": 44229,
                "value2017": 61000
            }
        ]
    }
]
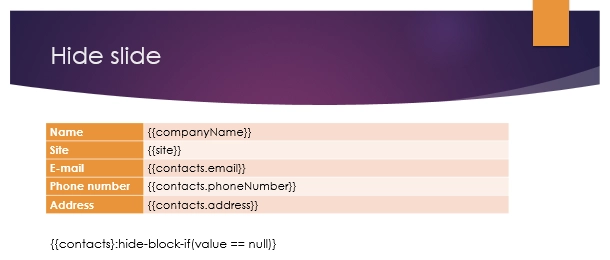
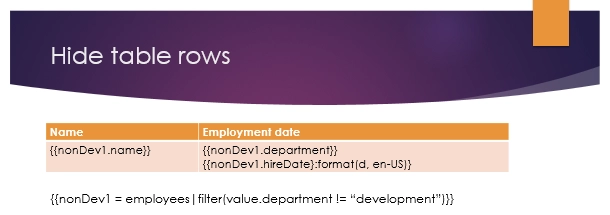
Conditionally hide content
This demo shows how to hide table rows, bullet list items, arbitrary presentation slides and arbitrary text.
You can find the description of this case in the conditionally hide content documentation.
Scroll down to see source data for the template in JSON format.
Template |
Result |
|---|---|

|


|
Template data
{
  "companyName": "Plumsail",
  "site": "http://plumsail.com",
  "contacts": null,
  "employees": [
    {
      "name": "Derek Clark",
      "hireDate": "2012-04-21T18:25:43-05:00",
      "department": "marketing"
    },
    {
      "name": "Jessica Adams",
      "hireDate": "2012-04-21T18:25:43-05:00",
      "department": "sales"
    },
    {
      "name": "Anil Mittal",
      "hireDate": "2016-04-11T14:22:13-02:00",
      "department": "development"
    }
  ],
  "hideConfNotice": "true"
}