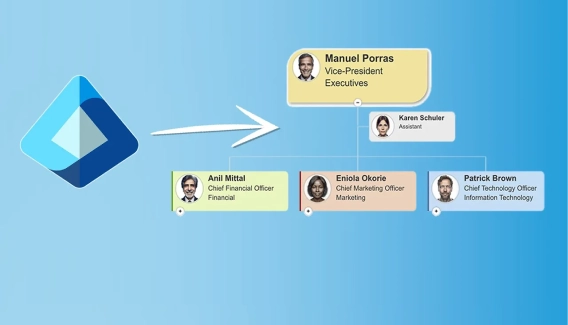
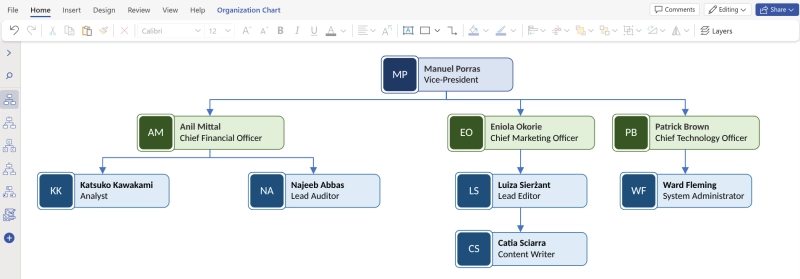
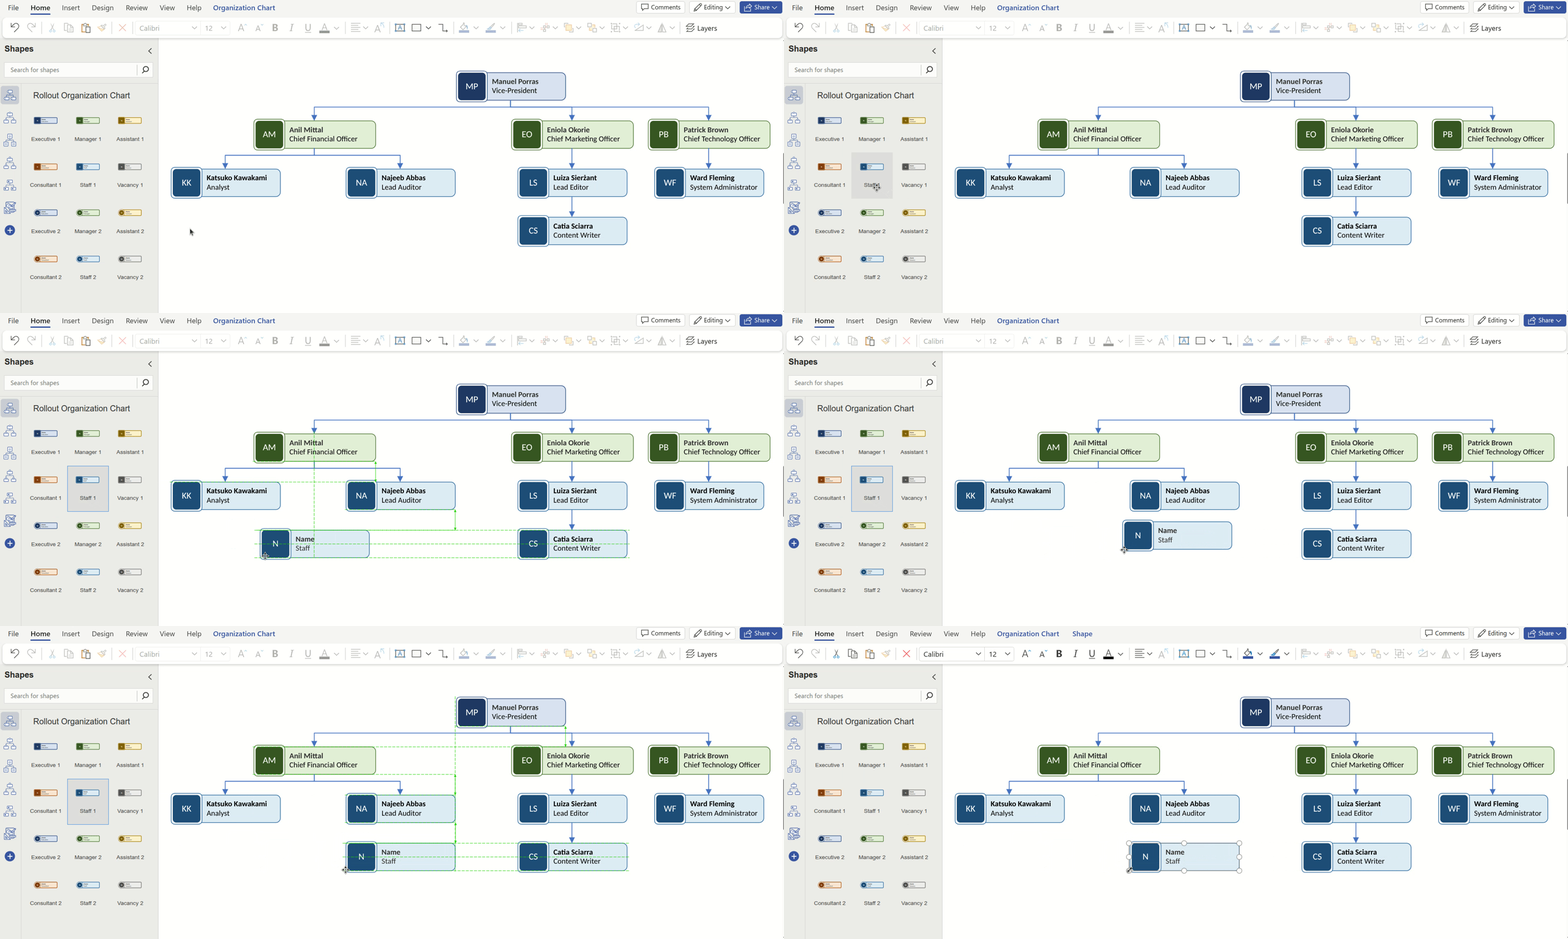
Many HR and IT teams come to us looking for a way to replace a manual Visio org chart. What starts as a simple diagram quickly becomes difficult to maintain as employees join, leave, or change roles.
Every time someone joins or leaves, somebody has to update the Visio file. Eventually people stop trusting it.
HR Manager, Manufacturing, Germany
We're spending more time maintaining the org chart than actually using it.
IT Manager, Healthcare, United States
Our SharePoint site always ends up showing an outdated PDF because nobody remembers to replace it.
Internal Communications Manager, Government, Australia
If that sounds familiar, it's a sign to replace your static Visio chart with a live version that stays synchronized with your data source automatically — no exports, no re-drawing, no outdated PDF sitting on your SharePoint page.
A Visio org chart is easy to start. Drop in a few boxes, or import a CSV to lay out the first version of your structure, and you already have something to show.
Exporting it as a PDF and publishing it on a SharePoint page is easy too. That's usually where the trouble starts: the moment your company or team changes, you have to repeat the whole process: Add new employee boxes, redraw the reporting lines, re-export the PDF, and re-upload it to SharePoint.
That workflow doesn't scale. What starts as a simple Visio diagram quickly creates several problems:
No employee search: you can't quickly find a person or role in the chart
No profile navigation: each box is just a shape, not an interactive employee profile
Manual photo updates: photos have to be added and replaced one by one
Duplicate department views: creating a separate view means duplicating and maintaining several diagram
After a few rounds of edits, the chart still doesn't provide what HR, IT, or managers expect from an organizational chart. At that point, it helps to define what the replacement actually needs:
Automatic synchronization with Microsoft Entra ID and SharePoint
Employee photos that update automatically
Interactive employee profiles
Searchable directory instead of a static diagram
Department and teams views without duplicating the chart
Dotted-line managers for matrix organizations
Assistant relationships alongside direct reporting lines
Vacancy positions to support workforce planning
Reporting for compliance and audits
Once the list looks like that, you're no longer looking for a drawing tool. Instead, you need a chart that connects directly to your data and can be customized as your structure evolves.
Replace Visio with a live SharePoint Org Chart
At this point, you no longer need another drawing tool. You need an org chart that stays in sync with your organization and doesn't require constant manual updates.
That data-first approach is exactly what people compare their solution against once they've looked into alternatives:
Plumsail Org Chart is the best. You either need to get the data sync'd to AAD or you need to build a flow to pipe the data into a SP List and Plumsail can reference that.
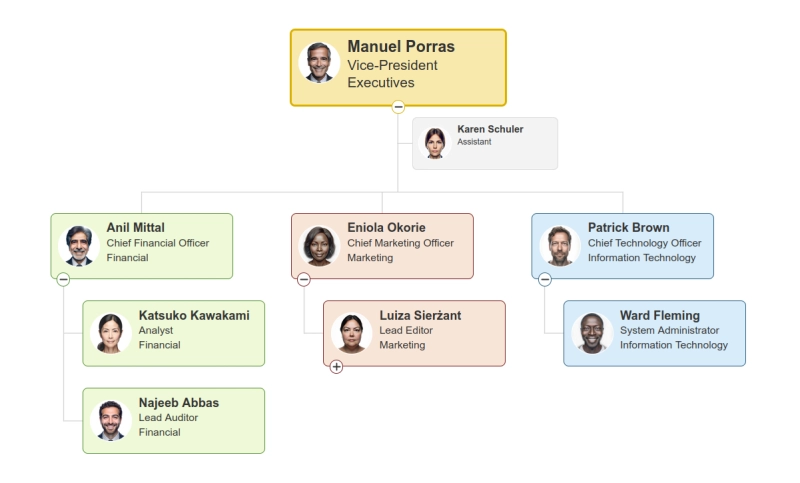
With Visio, the diagram is something you edit. With Org Chart, the chart is generated dynamically from your data. As your employee data changes, the chart updates automatically, eliminating the need to manually add boxes, redraw reporting lines, or export a new PDF whenever someone joins, leaves, or changes roles.
Customize the chart
Once the chart is connected to your data, decide what to show and how it looks like. Org Chart applies customization rules for the whole chart automatically:
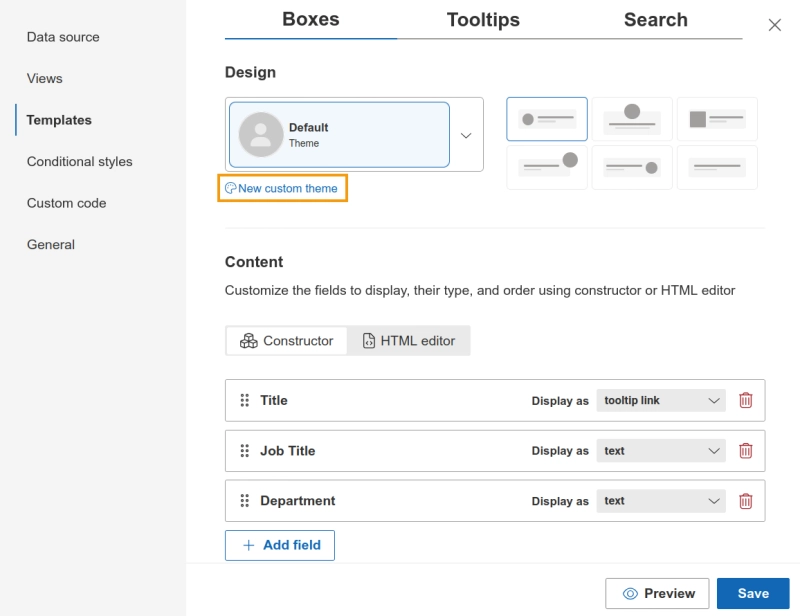
Themes: pick a theme or customize your own to control box colors, fonts, and borders for the entire chart
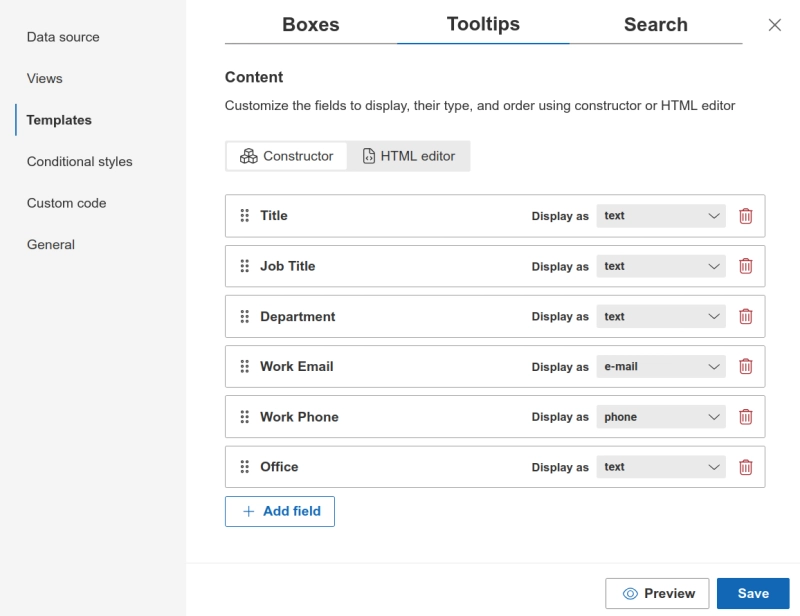
Templates: choose which fields show on a box, tooltip, or in search results, and how they're arranged, using the constructor or HTML editor
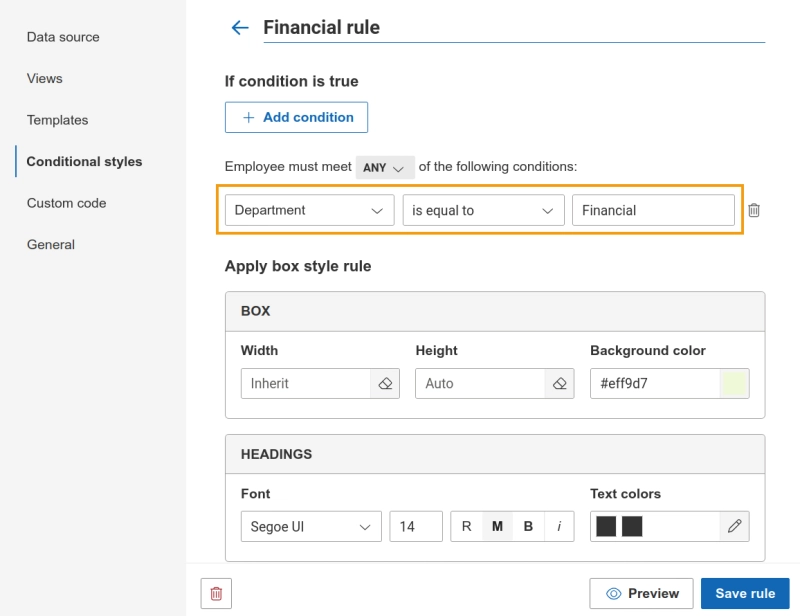
Conditional styles: automatically style boxes that match a condition, for example coloring every box where Department equals "Finance"
Display different types of employees
Not every employee fits a simple solid line relationship. Org Chart also supports:
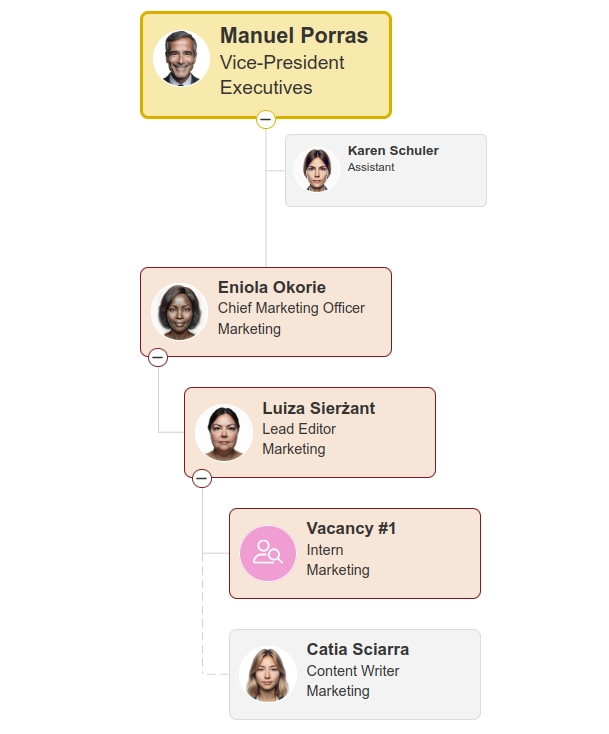
Dotted-line managers: for matrix organizations, where someone reports to a secondary manager alongside their direct one
Assistants: adds them next to the person they support instead of inside the hierarchy tree
Vacancies: include open positions on the chart before a role is filled
Create filtered views
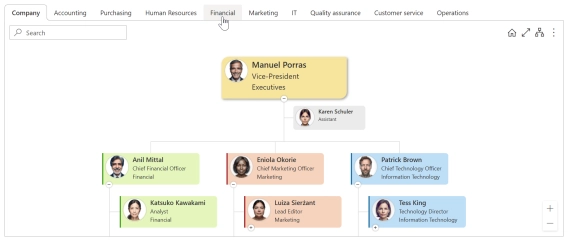
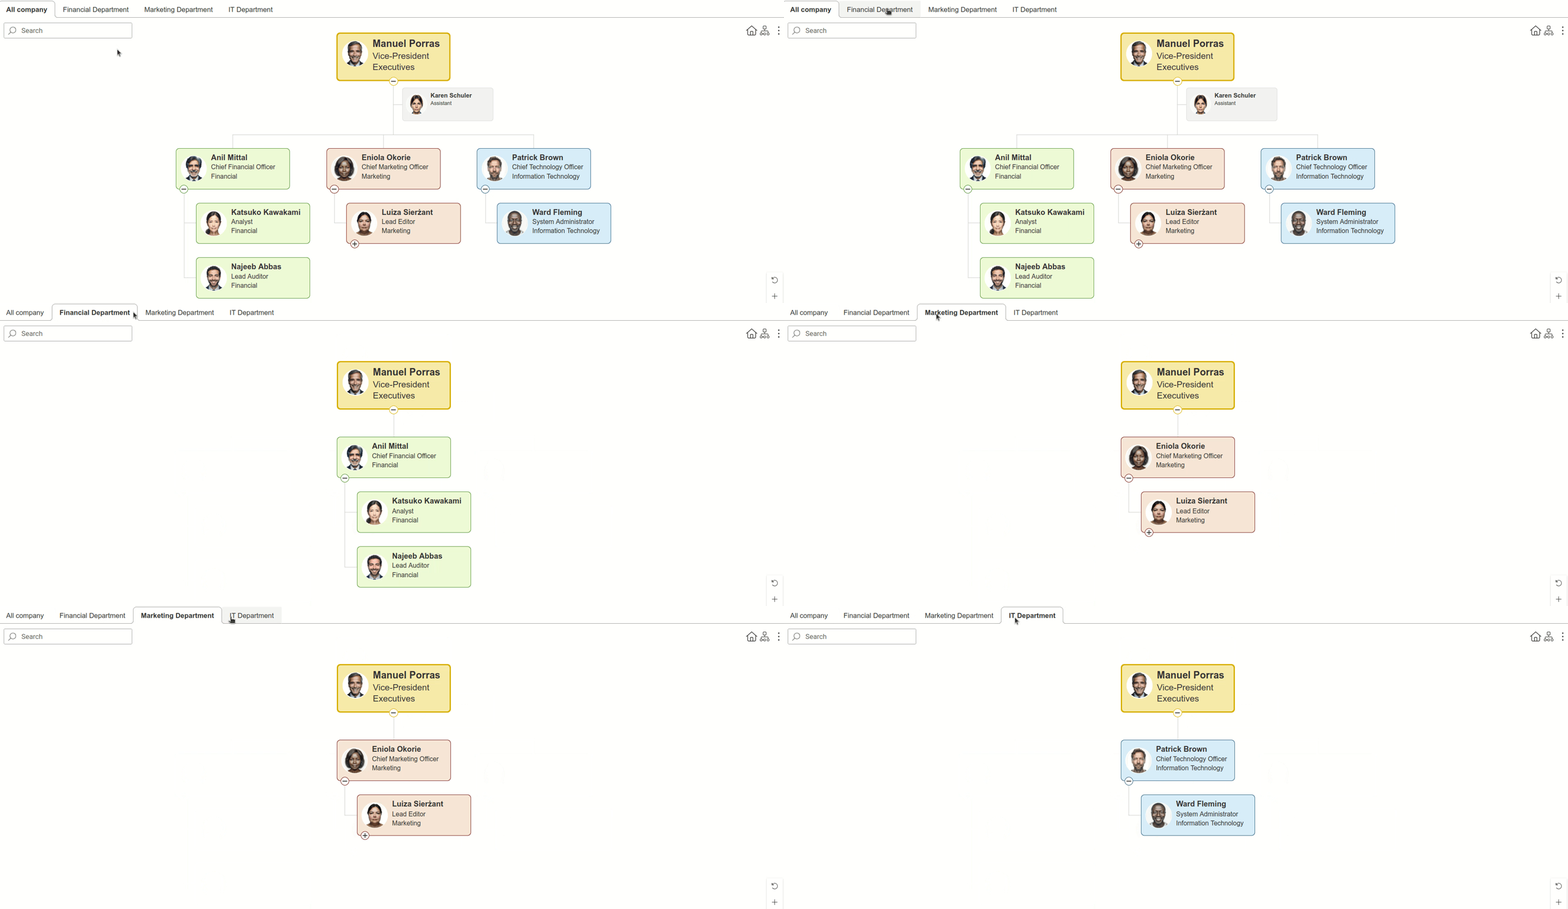
Instead of duplicating the whole diagram for every department like you would in Visio, you create different views in the same live chart. Each view will be configured independently:
Starting employee: pick up to three employees as the root of the view, or leave it blank for automatic selection
Layout type: how boxes are arranged
Levels to expand: how many reporting levels are open by default
Max columns: how many boxes show per row
Sort by: order employees by a field value
Filtration conditions: show only boxes matching a rule with all or any of the conditions you set
Views appear as tabs, so people can switch between without you maintaining separate files.
Navigate the org chart
Day to day, the web part also works as an interactive directory rather than a diagram:
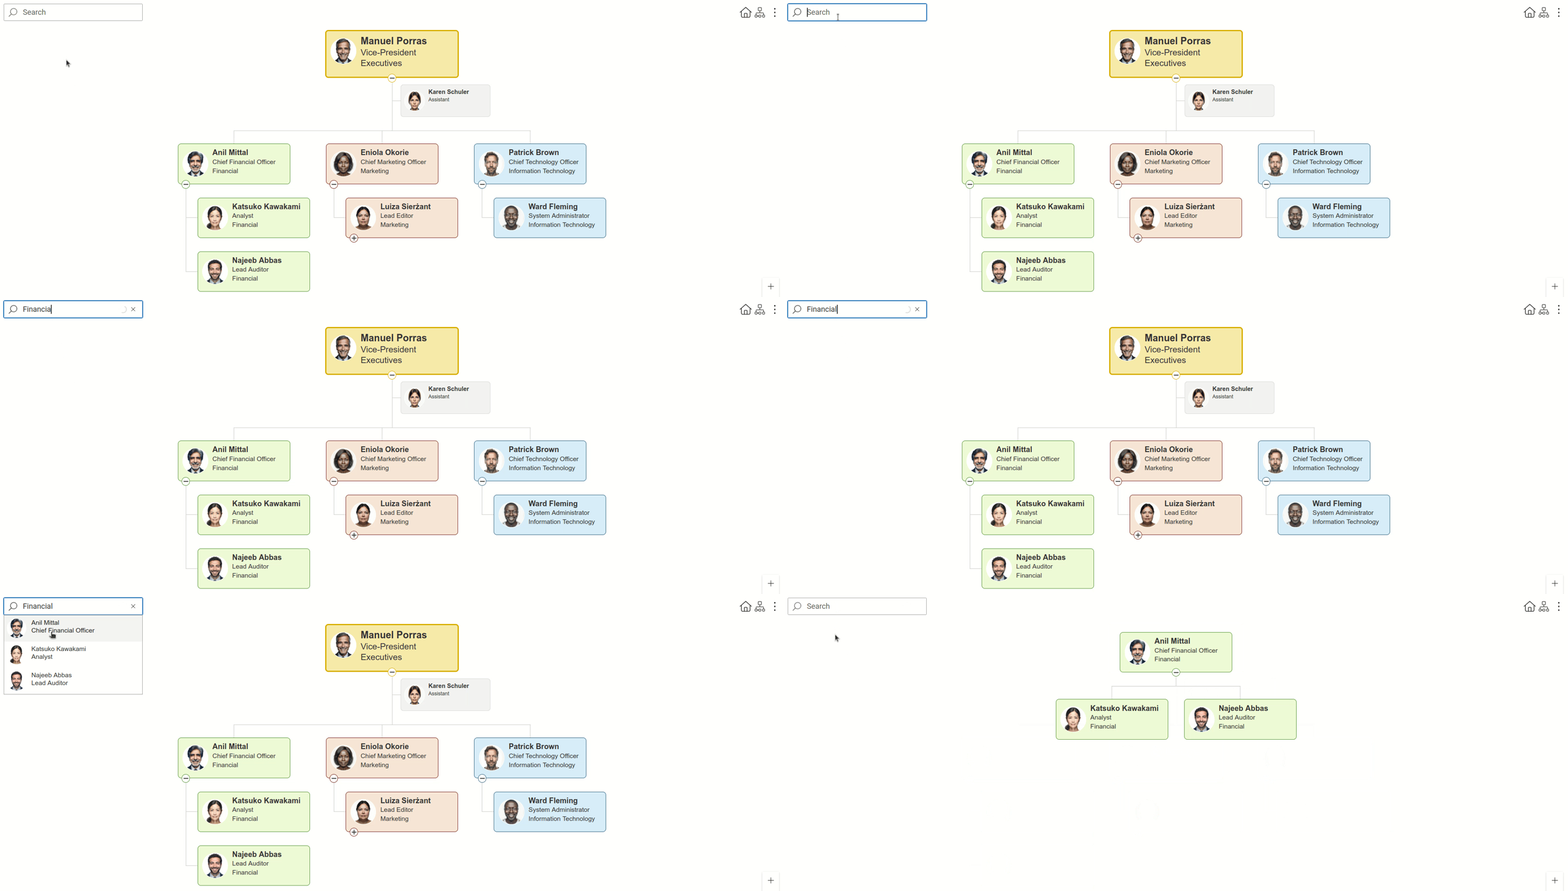
Employees can search for a colleague, for example, by department.
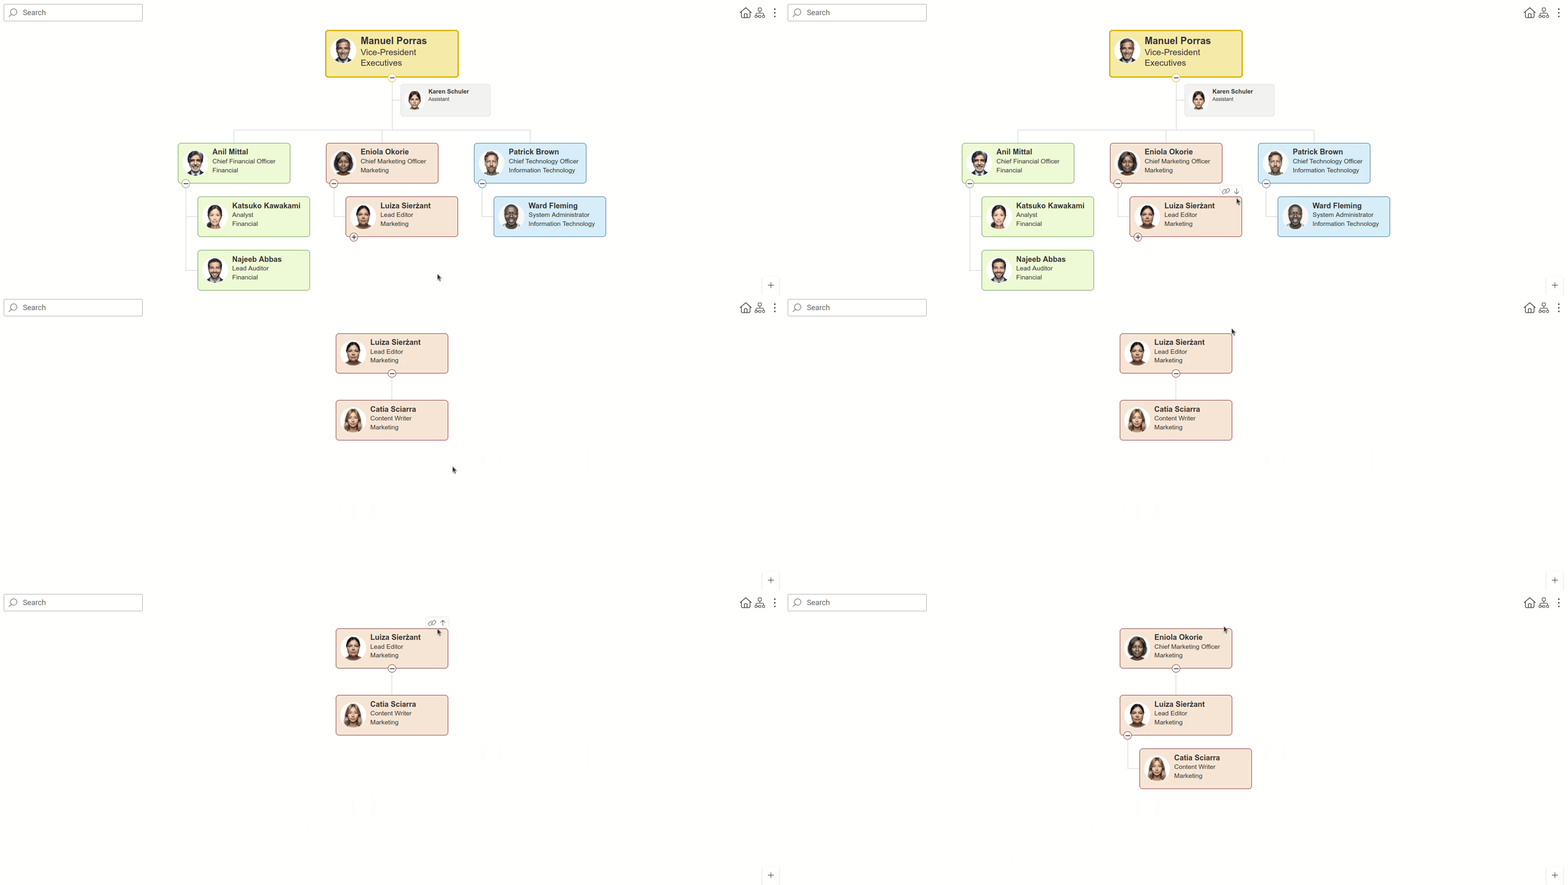
Anyone can drill up or down through the reporting structure instead of scanning a flat image.
That means a new hire, a manager, or an auditor can open the chart and navigate by department, team, or any other grouping you define as a view, without anyone needing a special diagram for each one.
Generate reports
And the live chart isn't the only thing kept up to date. You can also export a PDF report whenever you need a static snapshot, for example to satisfy a compliance requirement or archive the structure on a specific date. The difference is that the PDF becomes something you generate on demand for a particular purpose, not the main chart you maintain.
Migrate from Visio to Plumsail Org Chart
If you're migrating from Visio, one trade-off is worth naming upfront: you won't import your Visio diagrams directly. They're drawings, not structured employee data, so there's nothing for Org Chart to read from them. Instead, you connect to the data your company already has, and Org Chart builds and maintains the chart from that. It's a one-time setup instead of the recurring rebuild you're used to.
Here are the most common starting points.
Using Microsoft Entra ID or SharePoint User Profiles
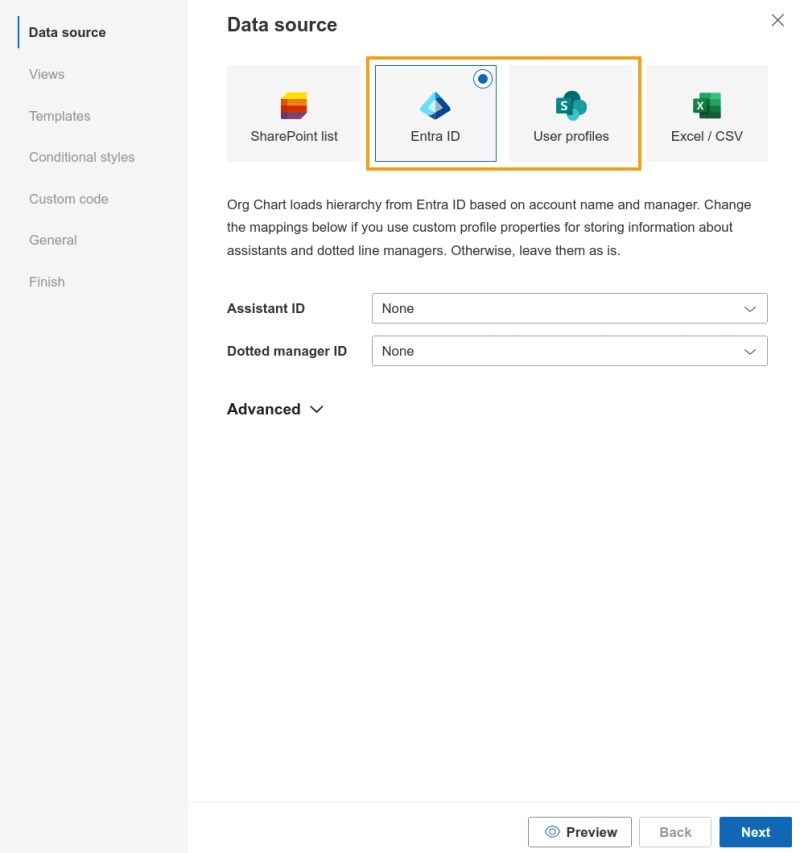
If your employee data already lives in Entra ID or SharePoint User Profiles, select that data source in the first step of the configuration wizard.
Field mapping, including employee ID, manager ID and photo, is handled automatically, so there's no manual setup before you move on to the next step of the wizard.
Using SharePoint Lists
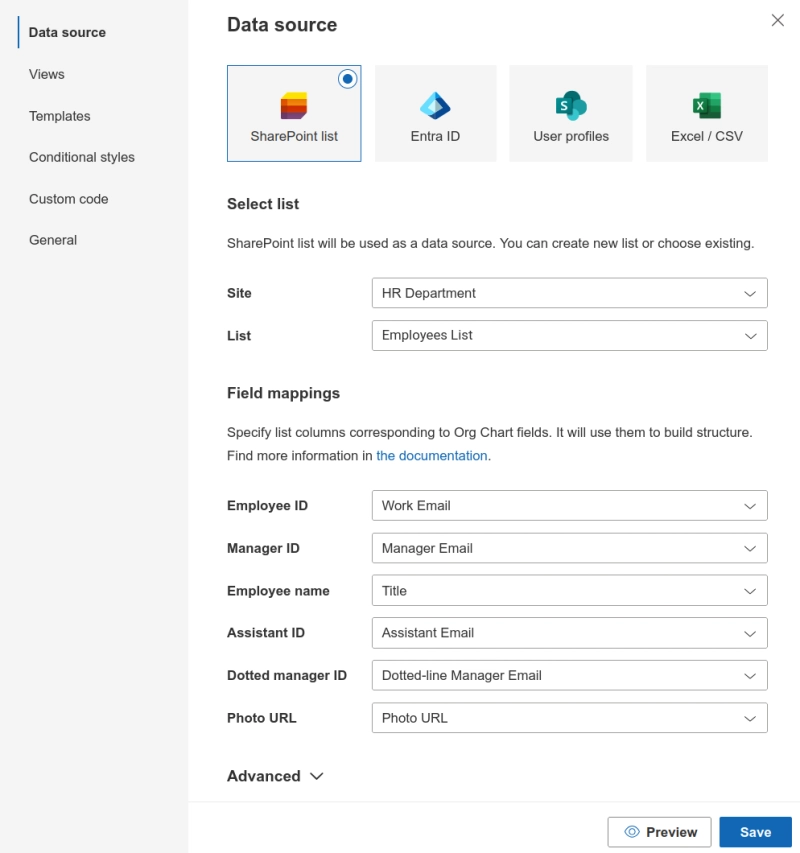
If your employees are tracked in a SharePoint list, pick the site and list from a dropdown, then map the relevant columns — employee ID, manager ID — to the fields Org Chart expects.
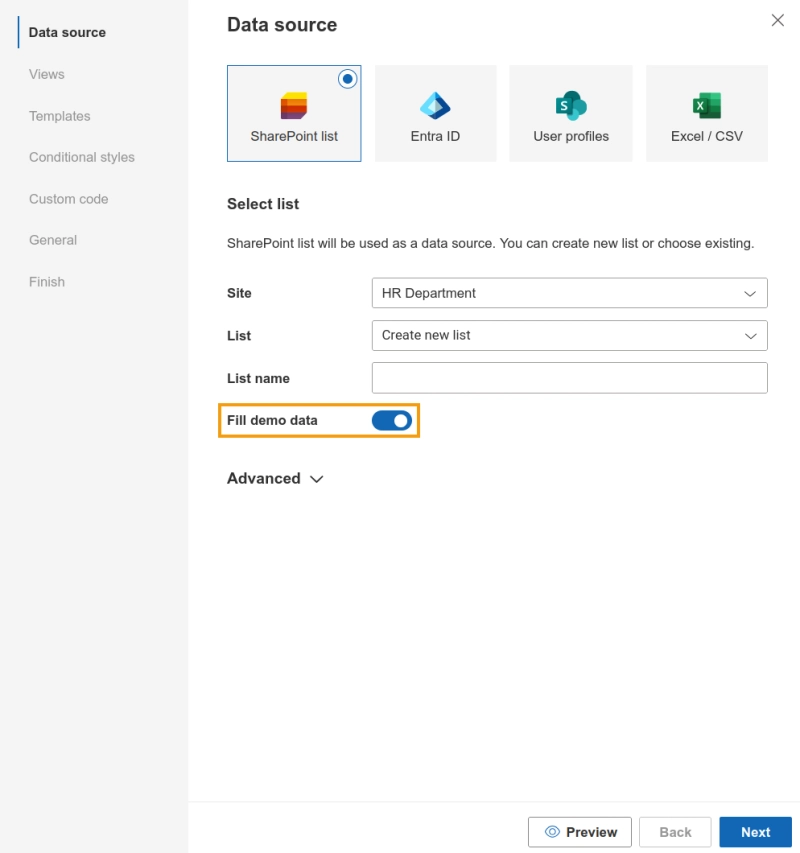
You can adjust this mapping later, so it's fine to start with the columns you already have. If you don't have a list ready yet, the wizard also includes a demo list you can use to see how the data should be structured before you build your own.
Using Excel or CSV
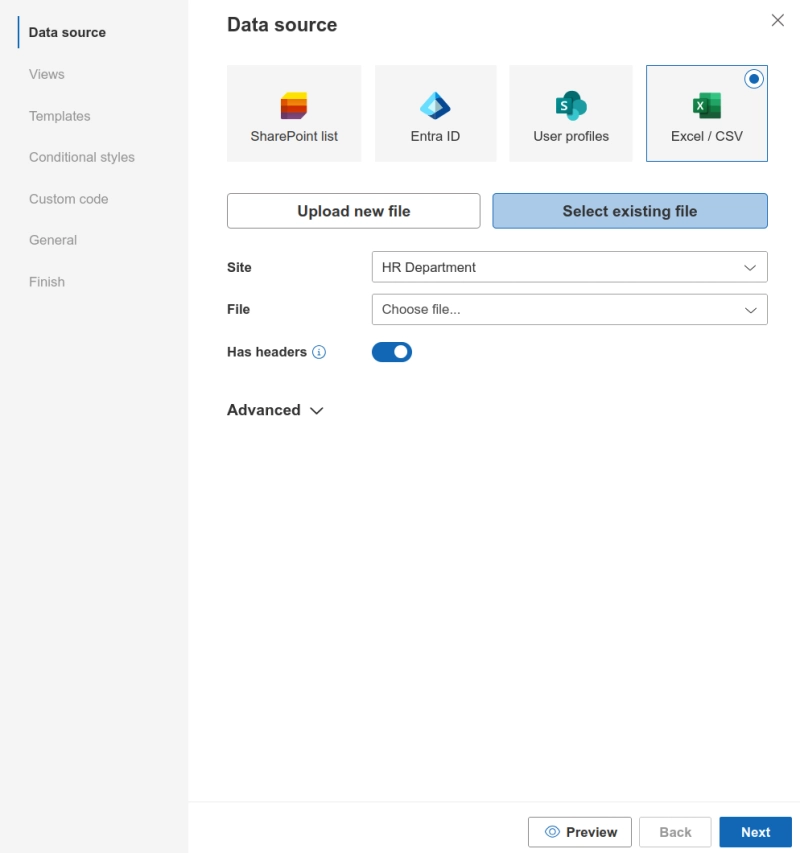
Many HR systems export employee data as XLSX or CSV. From there, in the wizard, you can either:
upload the file to a SharePoint document library, or
upload it directly to Org Chart from your computer.
Once Org Chart reads the file, map the columns to the fields you need and continue through the wizard.
This path is especially relevant if you were using the Visio Data Visualizer add-in for Excel, which Microsoft retired on March 2, 2026. If your org chart lived in an XLSX file through that add-in, switching to Org Chart is straightforward, as you're migrating the same employee data. Keep in mind you're importing only the data present in the spreadsheet, not any diagram the add-in previously generated from it, since those were drawings rather than structured records.
After choosing a data source, you can either start working on your views and conditional styles, or finish the wizard and come back to customization later.
What is the best Microsoft Visio replacement for organizational charts?
If you are looking for a chart that stays synchronized without manual work, Plumsail Org Chart is built specifically for this. It connects to Entra ID, SharePoint, and Excel/CSV, and updates automatically as your data changes, instead of relying on a static drawing you need to re-export by hand.
Can I replace a Visio org chart in SharePoint?
Yes. Plumsail Org Chart runs as a SharePoint web part, so you can add it to the same site where your Visio PDF currently lives and connect it to a real data source instead of using an exported image.
Can I automatically generate an org chart from Microsoft Entra ID?
Yes. Choose Entra ID as the data source in the configuration wizard and Org Chart will map all fields automatically. Then, it keeps them in sync as people join, leave, or change roles.
Can I migrate my existing Visio org chart?
Not the diagram itself, because Visio files are drawings, not structured data, and there's nothing to import directly.
What you can migrate is the employee data that Org Chart will use to build the chart from it, including if you previously used the now-retired Visio Data Visualizer add-in for Excel.
Start your Visio replacement today
Visio is a solution aimed for a one-time diagram, but it was never built to track a structure that keeps changing. Every update in your company is a chance for the chart to fall out of sync, and eventually, people stop trusting it. Replacing Visio isn't only a tool swap, but also it's removing the manual maintenance step entirely by connecting directly to Microsoft 365 data that's already accurate.
Need a quick walkthrough first? Schedule a 15-minute demo call with our specialists. And if your setup includes unusual data structures or custom fields not covered here, contact our support team and we'll help you with the migration.
Related posts
Customer storyOrg ChartSharePoint
Nov 06, 2025
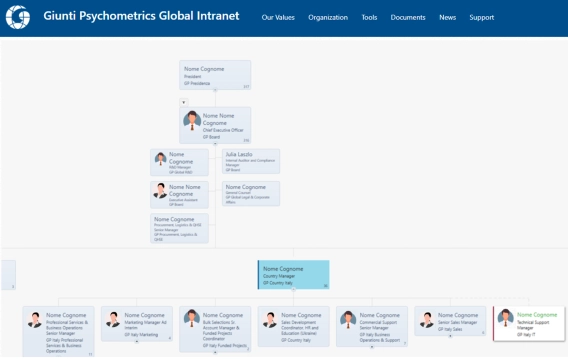
How live SharePoint org charts replaced manual PowerPoint diagrams at Giunti Psychometrics
Learn how Giunti Psychometrics moved from time-consuming PowerPoint updates to live org charts directly in SharePoint.
Tommaso Salsetta
Technical Support Manager at Giunti Psychometrics
Org ChartSharePointMicrosoft Teams
Nov 11, 2024
Create an Org Chart from Active Directory
Learn how to create an org chart from Active Directory for Microsoft Teams and SharePoint with this step-by-step guide for easy setup and configuration.
Borko Bacic
Digital Marketing Specialist
Org ChartSharePoint
May 23, 2025
Save Filtered Views in SharePoint Org Chart by Department, Team, Location, and More
Learn how to create custom views in SharePoint Org Chart with options for advanced filtering using JavaScript.



 Org ChartSharePoint