How to create online quiz and visualize results with Excel charts
In this article, you will learn how to gather information from submissions and build simple charts for data analysis in Excel.
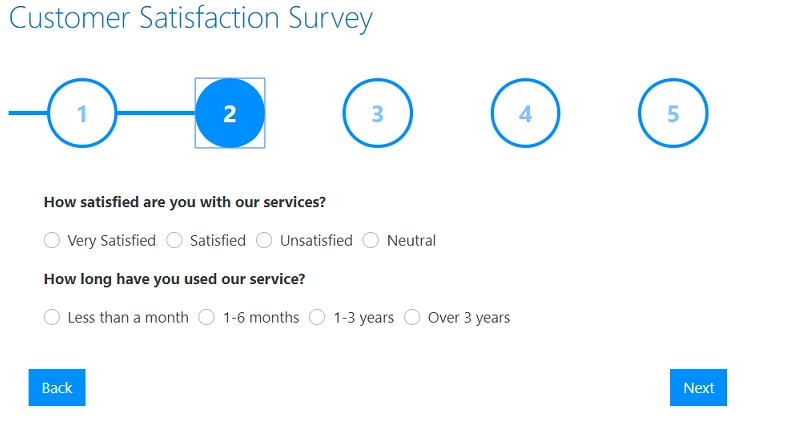
For this, we’ve created a Customer Satisfaction survey to analyze service loyalty and clients’ average age.
Form overview
The form has the following fields:
Name (text field),
Email (text field),
Age (numeric field),
How satisfied is the customer with the services? (radios field),
How long has the customer using the service? (radios field),
What does the customer like the most about the services? (radios field),
What does the customer dislike the most about the services? (radios field),
Will the customer use the services in the future? (dropdown field),
Will the customer recommend the service? (dropdown field),
Comments (multiline text field).
Questions in the form are structured with wizard containers.
You can download this form and import to the desktop designer..
Export submissions
First, you need to enable saving the form submissions. For this:
Login to your Plumsail Account
Choose ‘Forms’ in the products list
Click the ‘Forms’ item in the left menu
Select a form which submissions you want to store in your account
And turn on the ‘Save posts’ option
Then, in your Plumsail account, you will see a list of submitted forms. Export the data to a CSV-file.

Build charts
To import CSV file to excel, please do the following:
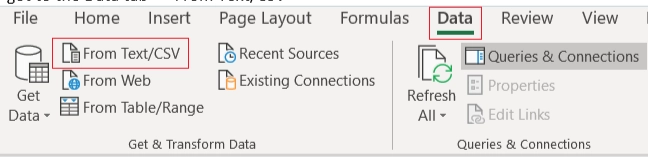
Go to the Data tab >> From Text/CSV
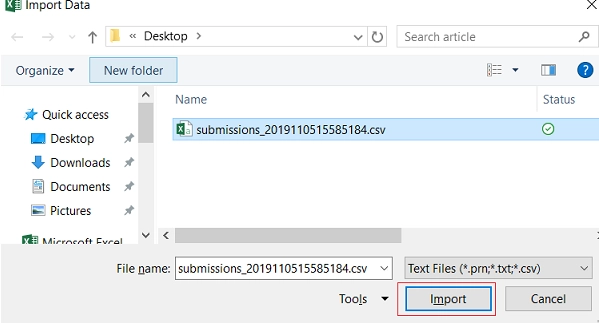
Navigate to CSV file. Click import
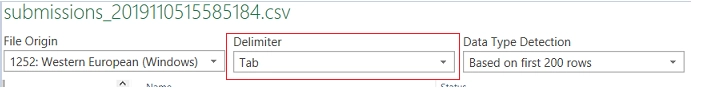
In the dialog window, set the Delimiter to Tab and click the ‘Load’ button.
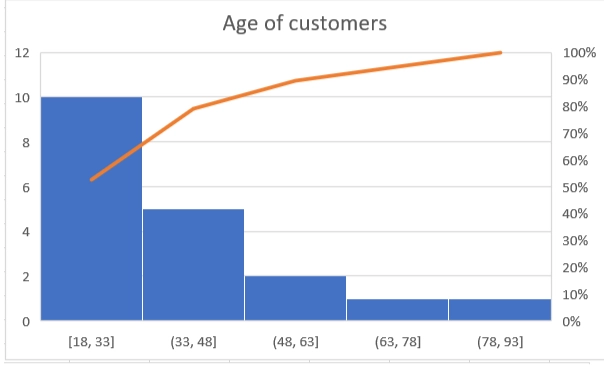
You can build charts and tables based on the loaded data. For example, you can build a Pareto chart to analyze the age distribution of your customers.