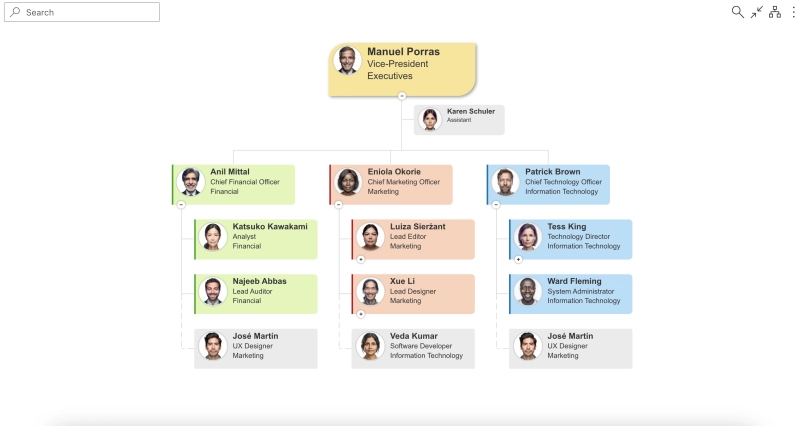
In this article, we explore how to set up and use a dotted line Org Chart and how to show dotted line reporting using Plumsail Org Chart. This type of reporting is used when an organization has a matrix reporting structure with indirect reporting relationships or dotted line managers.
We will start by explaining the basic concept of indirect reporting, learn how to set it up properly, and see a couple of examples.
Dotted line reporting refers to an indirect reporting relationship in an organization. For example, if an employee has a solid line manager, they may also indirectly report to a secondary manager, or multiple secondary managers, depending on the projects and tasks they are working on. This is a less formal type of reporting relationship, and it is particularly useful in matrix organizations, cross-functional teams and project-based reporting.
Benefits of dotted line reporting
Dotted line reporting offers several advantages, including the following:
Flexibility: Cross-functional teams can collaborate without altering the primary, or solid line, reporting structure.
Adaptability: Organizations can quickly adapt to new business challenges by assigning secondary managers without changing the team structure.
Project management: Enables managing employees working on the same project but from different departments.
Enhanced organizational efficiency: Optimizes resources by utilizing employees with the necessary skills and capacity.
Start configuration process and select your data source
Choose the Dotted line Manager ID for your data source
Optional – select a specific design for the box using box type as a condition to be more recognizable
Publish Org Chart and share it with your employees as a web part in SharePoint and add it to Microsoft Teams as a tab
Watch this step-by-step tutorial to learn how to configure a Dotted-line Org Chart using different data sources in Plumsail Org Chart for SharePoint and Microsoft Teams.
Dotted line Org Chart best practices
Once you implement dotted line reporting in your organization and assign dotted line managers to your employees, make sure to display it properly on your Org Chart. There are a few general rules to follow:
Create custom fields. Add custom fields in your data source to be displayed in templates (boxes, tooltips and search results). This way, different projects an employee works on can be highlighted and made visible for everyone.
Limit to 2 dotted line managers per employee. According to the American Psychological Association there is a hidden cost of task switching while multitasking. It is crucial to choose the right strategy if you want to implement this option and allow your employees to work on different projects at the same time.
Update regularly. Keep the organization chart up to date as roles change and projects finish. It is important to accurately reflect the current structure.
Dotted line org chart examples
By default, you can display dotted line managers in Plumsail Org Chart in SharePoint and Microsoft Teams when you use following data sources:
It supports multiple dotted-line managers for an employee. The following examples illustrate cases where an employee has one or more indirect reporting relationships.
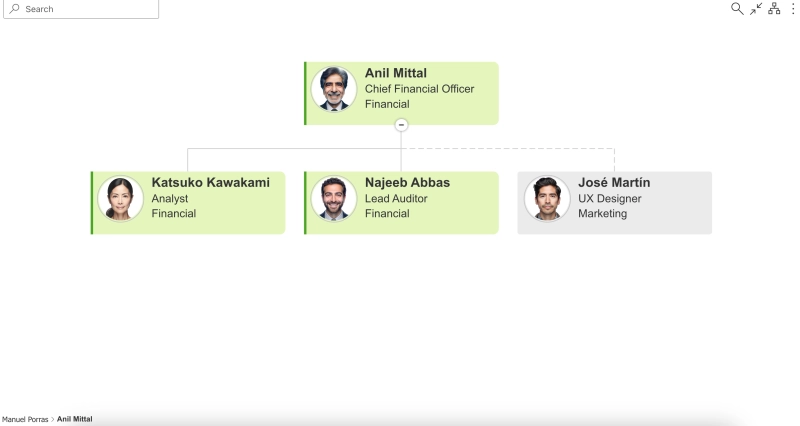
Show a single dotted line manager
You can easily show a single dotted line manager in your organizational chart by adding the necessary ID in the field mapping for the dotted line manager ID during the configuration process. This field mapping ID will depend on the data source you use and the field name you have for dotted line manager in the selected data source. It is crucial to select the correct field mapping ID.
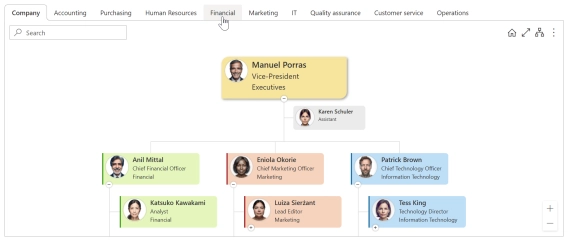
See an example of how it looks when implemented:
Show multiple dotted line managers
Setting up multiple dotted line managers depends on the data source you use for your employee database. But in general, it involves these steps:
Create and organize your database. Include the dotted line manager property and decide which ID you will use for it (work email, list ID, etc.)
Select appropriate data source in the configuration process when setting it up
Make sure you correctly enter the managers'ID into the managers'field in the database for mapping purposes.
Select correct filed mapping for dotted line manager ID. If you created a custom property in your data source, select that property name as ID.
See an example of how it looks when implemented:
Get started with Plumsail Org Chart for SharePoint and Microsoft Teams
Unlock organizational insights with our interactive Org Chart for SharePoint and Microsoft Teams and connect your workforce.
Start a 30-days free trial to gain full access and explore all the features. If you have any questions, you can schedule a demo call with our team to discuss your requirements and determine whether it is a good fit for your needs.
SharePoint Online CSP enforcement (March 2026). Why Plumsail tools may not load and how to fix it
Starting March 1, 2026, SharePoint Online CSP enforcement may block external scripts and prevent Plumsail HelpDesk, Org Chart, and Forms from loading. Learn how to fix it by adding trusted script sources.
Petr Bushuev
Customer Support Engineer
Org Chart
Customer Story
Nov 06, 2025
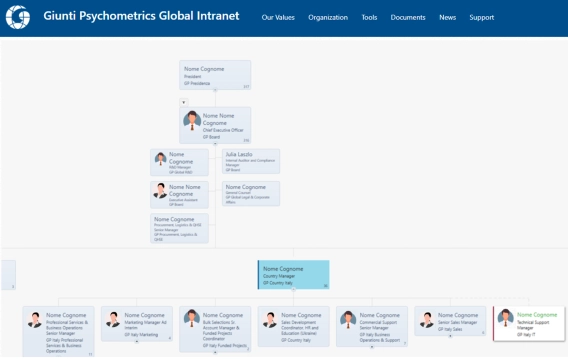
How live SharePoint org charts replaced manual PowerPoint diagrams at Giunti Psychometrics
Learn how Giunti Psychometrics moved from time-consuming PowerPoint updates to live org charts directly in SharePoint.
Tommaso Salsetta
Technical Support Manager at Giunti Psychometrics
Org Chart
May 23, 2025
Save Filtered Views in SharePoint Org Chart by Department, Team, Location, and More
Learn how to create custom views in SharePoint Org Chart with options for advanced filtering using JavaScript.