Install Charts to SharePoint Online (Microsoft 365)
This article covers how to install and start using Plumsail Charts in SharePoint Online.
Install app package to your tenant
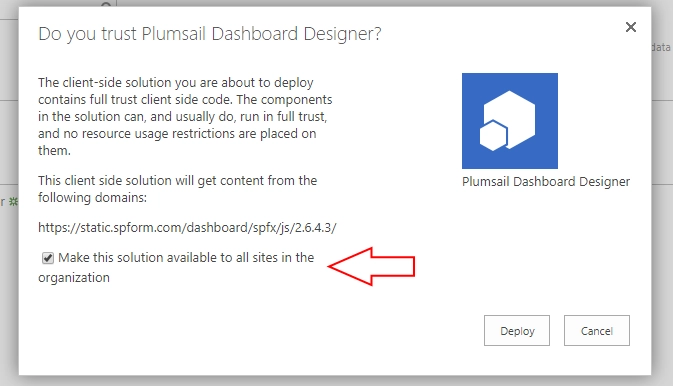
First step to install Charts for SharePoint Online is to fill in this form. Make sure to select SharePoint Online in Microsoft 365. Then, you’ll get a link to download Dashboard Designer package for Microsoft 365. This package needs to be uploaded to your App Catalog. Please, follow instruction from Microsoft to create an App Catalog if you don’t have one yet. Then download the package and upload it to the App Catalog. It’s recommended to turn on the “Make this solution available to all sites in the organization” option. Click “Deploy”:
Configure Trusted Script Sources
Charts rely on external scripts from Plumsail servers in order to work properly. To ensure Plumsail scripts are successfully loaded, follow these steps:
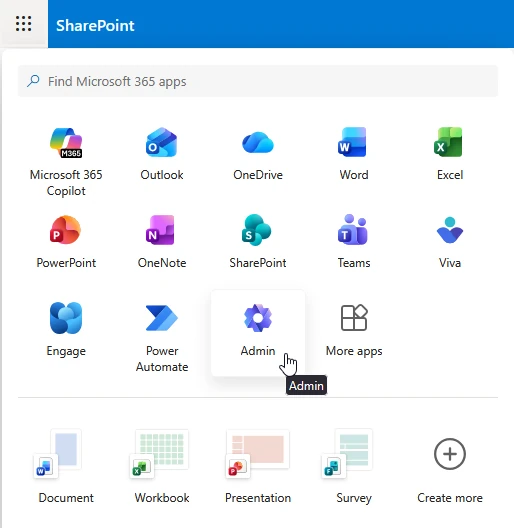
Navigate to the Global Admin Center
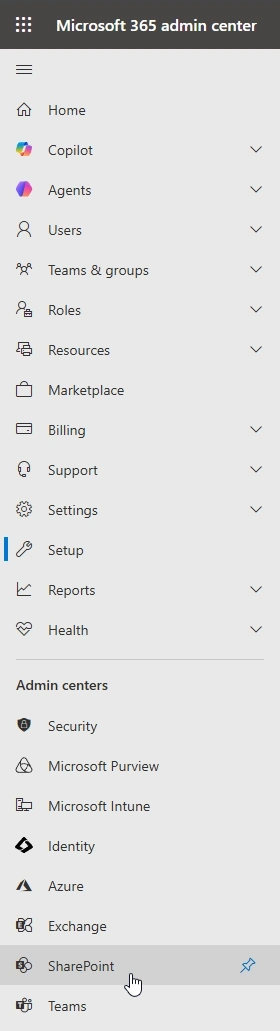
Go to the SharePoint Admin Center
Expand Advanced > Script sources
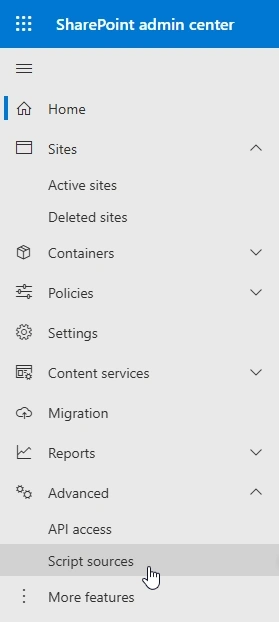
Add https://*.spform.com to the list:

Now you can navigate to a page where you want to add a chart and insert Charts web part.
Add Charts to Modern SharePoint pages
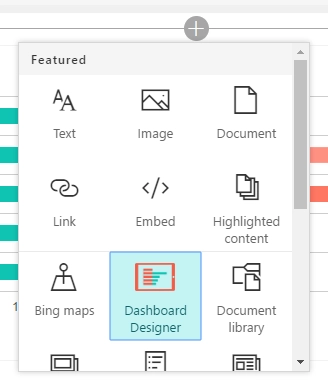
Simply add a new page or go to an existing one, click + sign to add a new web part and select Charts:
Add Charts to Classic SharePoint pages
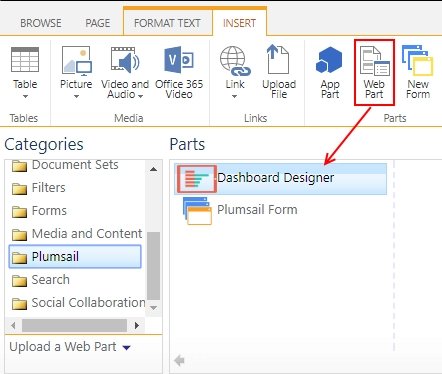
Simply add a new page or go to an existing one, in the ribbon select “Insert” and click “Web Part”, then select Plumsail folder and add Charts: