Link chart to another chart
Demo

Configuration
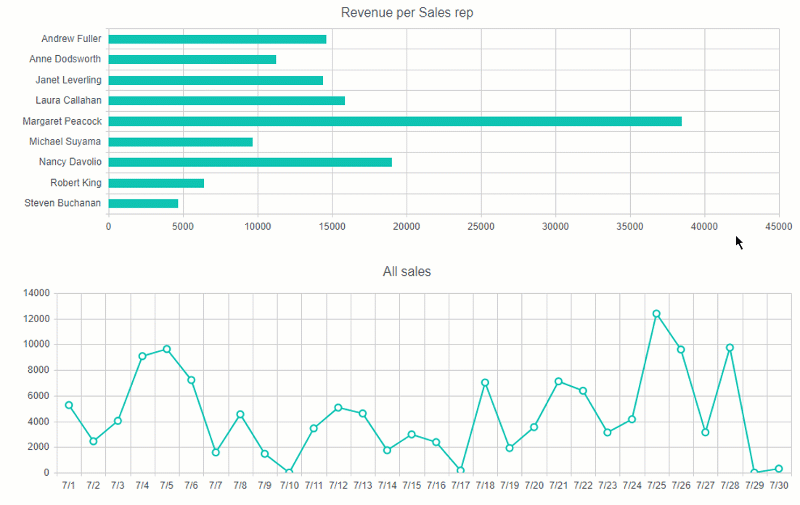
This case covers linking a SharePoint chart to another that expands the main chart and conveys more detailed information on the selected series. Here I’ve created two charts: Revenue per Sales representative and Sales over a time period. You can find the first chart in our demo. The second one is quite easy, it just displays sum of all orders by date.
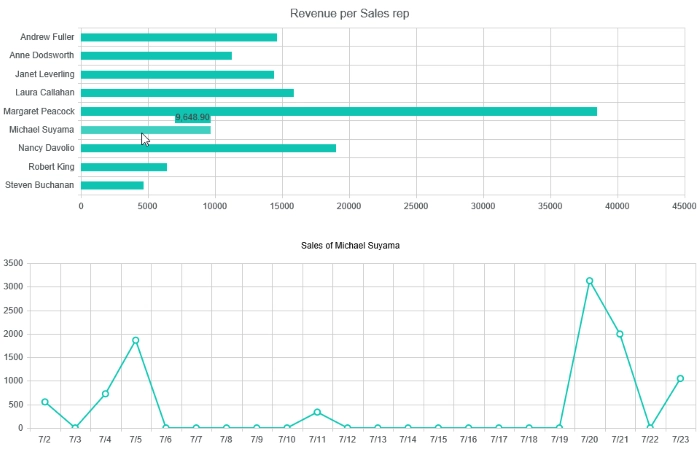
Now that a user clicks on a particular sales rep in the first chart, I want to display sales of the selected sales rep in the second chart. I will pass information on the selected series via a hash part of a URL. In this case a user will be able to select a sales rep, copy the URL from his/her browser, and open it in another browser or send to another user. The filtration will save after opening such a link.
Open the first chart (Revenue per Sales rep.) in SharePoint Designer and navigate to the Dashboard → Advanced tab. Insert the following code in it:
var handlers = {};
handlers.preRender = function (config, logger) {
    logger.debug('Configuration: ', config);

    var filtrationApplied = false;

    config.plotAreaClick = function (e) {
        if (!filtrationApplied) {
            window.location.hash = '';
        }

        filtrationApplied = false;
    }

    config.seriesClick = function (e) {
        window.location.hash = 'userId=' + e.dataItem.SalesRepId;
        filtrationApplied = true;
    }

    config.axisLabelClick = function (e) {
        if (e.axis.type === 'category') {
            window.location.hash = 'userId=' + e.dataItem.SalesRepId;
            filtrationApplied = true;
        }
    }

    return true;
}
Here I subscribed to three events: plotAreaClick, seriesClick, axisLabelClick. The first one is raised when the user clicks the plot area, the second – when a user clicks a particular series and the last one – when a user clicks a particular sales rep in category axis. Depending on the area which the user clicks, I pass Id of the appropriate sales rep. in userId parameter of the hash.
Now, let’s navigate to the second chart and configure filtration by the selected sales rep. Open the Data Source → SharePoint list tab. Here I injected {Filter} token into CAML-query that I will replace via JavaScript in requestInit handler:
<View>
    <Query>
        <OrderBy>
        <FieldRef Name="ID" />
        </OrderBy>
        {Filter}
    </Query>
    <ViewFields>
        <FieldRef Name="LinkTitle" />
        <FieldRef Name="OrderDate" />
        <FieldRef Name="Total" />
        <FieldRef Name="Customer" />
        <FieldRef Name="SalesRep" />
    </ViewFields>
    <RowLimit Paged="TRUE">3000</RowLimit>
    <Aggregations Value="Off" />
</View>
Ok, now switch to the Advanced tab and define requestInit handler following way:
handlers.requestInit = function (query, logger) {
    var userId = 0;

    var hash = location.hash.substr(1);
    var idx = hash.indexOf('userId=');
    if (idx !== -1) {
        userId = parseInt(hash.substr(idx)
                            .split('&')[0]
                            .split('=')[1]);

        if (isNaN(userId)) {
            userId = 0;
        }
    }

    var view = query.get_viewXml();
    if (userId !== 0) {
        view = view.replace('{Filter}', '<Where>
            <Eq>
                <FieldRef Name="SalesRep" LookupId="TRUE" />
                <Value Type="Integer">' + userId + '</Value>
            </Eq>
        </Where>');

        query.set_viewXml(view);
    } else {
        query.set_viewXml(view.replace('{Filter}', ''));
    }

    return true;
}
Here I filter the source list by the value from userId property or just remove {Filter} token if the hash doesn’t contain userId property.
Finally, we need to subscribe to ‘hash changed’ event to reload the chart; and override title property to display the name of the selected sales rep. Go to the Dashboard → Advanced tab and insert the code below:
var handlers = {};
handlers.preRender = function (config, logger, processor, el) {
    logger.debug('Configuration: ', config);

    if (processor && !processor.subscribed) {
        $(window).bind('hashchange', function () {
            el.empty().html('<img alt="loading..." src="/_layouts/15/images/gears_anv4.gif" />');
            processor.process(el);
        });
        processor.subscribed = true;
    }

    if (location.hash.indexOf('userId=') !== -1) {
        config.title = 'Sales of ' + config.series[0].data[0].SalesRep;
    }

    return true;
}
As you can see, when the hash changes, the handler replaces the previous chart with the loading indicator and starts a new process of chart rendering. Also, I inserted the name of the selected sales rep into the title. Here is the result:
