
Use multiple lists in Charts
Using multiple lists in Charts
Today I’d like to introduce you to a way you can use Charts with multiple lists that can be located within the current site or on various sites in the current site collection. To illustrate this feature I will use two similar use cases.
Let’s say, you have multiple projects running in your company, each project has a separate site, all located under one site collection. The root site of the site collection contains a list of Projects with their relative URLs. Each project has a task list that contains all tasks assigned to every employee for that project. What we’ll do is get the project list, iterate over the projects, get the data located in the task lists in each of the projects and do some graphical presentation with this data.
Site collection hierarchy:
- /sites/project_tasks_demo (site collection)
- /Project (list)
- /Charts (page where our charts will be located)
- /market_research_project (one of the project subsites)
- /Task List (list containing tasks for the project)
- … other projects with similar structure
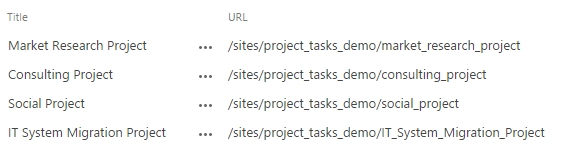
Our Project list:
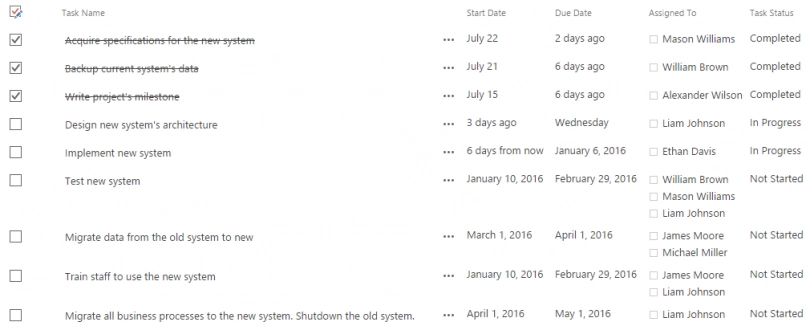
Task list in one of the projects:
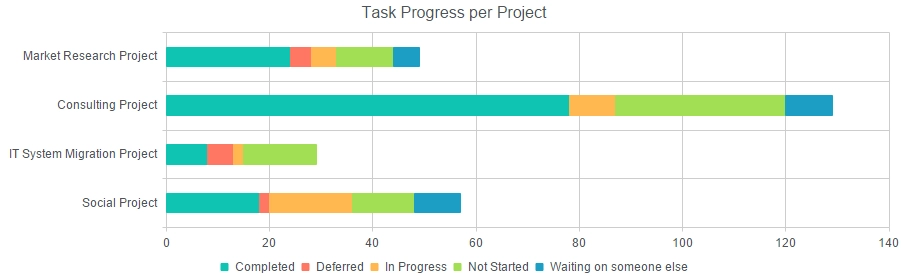
Task totals for each project, grouped by status
For this use case we’ll create a chart that displays Projects against their task counts for each status type, e.g. ‘Completed’, ‘Deferred’ and others.
This is how we’ll do this:
- Point Charts to /sites/project_tasks_demo location
- Select the Project list
- Select the ‘Title’ and ‘URL’ fields which represent names and locations of projects
- Paste the code below to the editor under the Advanced tab panel
- Click ‘Process’
- Go to Aggregation tab and select ‘Status’ as the ‘Group by’ value
- Click ‘Process’
- Go to Dashboard and select the following options:
- Bar chart
- Display each group as separate series
- Category: Project
- Value: ID
- Aggregate over category
- Unit: fit
- Step: auto
- Function: count
- Save. This is the chart that we get:
The code
//...

handlers.requestSuccess = function(data, logger) {
    var dfd = $.Deferred();
    var projectList = data.items;
    data.items = [];
    var deferreds = [];
    var query = new SP.CamlQuery('<View> <ViewFields>' +
    '<FieldRef Name="Status"/> <FieldRef Name="ID"/>' +
    '</ViewFields> <Query/> <Aggregations Value="Off"/>' +
    '<RowLimit Paged="TRUE">10000</RowLimit> </View>');
    for (var project in projectList){
        var d = request(query, projectList[project],
        'Task List', ['ID', 'Status'], data);
        deferreds.push(d);
    }
    console.log('All requests fired.');
    $.when.apply(null, deferreds).done(function() {
        console.log('All requests have been resolved.');
        dfd.resolve();
    });
    return dfd.promise();
}

//...

function request(query, project, listName, fields, data) {

    var dfd = $.Deferred();
    var ctx = new SP.ClientContext(project['URL']);
    var list = ctx.get_web().get_lists().getByTitle(listName);

    var itemCollection = list.getItems(query);
    ctx.load(itemCollection, 'Include(' + fields.join(',') + ')');

    ctx.executeQueryAsync(function () {
        var itemCollectionEnumerator = itemCollection.getEnumerator();
        while (itemCollectionEnumerator.moveNext()) {
            var listItem = itemCollectionEnumerator.get_current();

            var item = {};
            $.each(fields, function () {
                try {
                    var value = listItem.get_item(this);
                    item[this] = value;
                }
                catch (e) { }
            });
            item['Project'] = project['Title'];
            data.items.push(item);
        }
        console.log('Request to ' + project['URL'] + ' has been resolved.');
        dfd.resolve();
    }, function(caller, args){
        console.log('Error: ' + args.get_message());
    });

    return dfd.promise();
}
There are two parts to this code: the handler and the request function. The handler is executed by Dashboard Designer just after it retrieves data from the Project list. The handler iterates through project list and calls the query method to retrieve the task items from each of the projects’ task lists. Both functions use jQuery deferred objects in order to retrieve the items in a synchronous fashion.
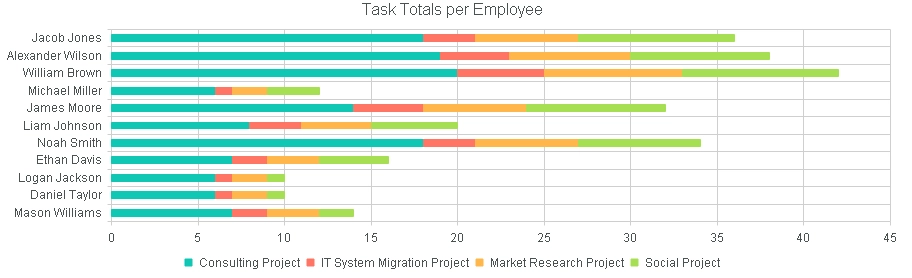
Task totals for each employee, grouped by project
This use case is about representing task count for each employee, grouped by projects.
In order to do this:
- Point Charts to /sites/project_tasks_demo location
- Select the Project list
- Select the ‘Title’ and ‘URL’ fields which represent names and locations of projects
- Paste the code below to the editor under the Advanced tab panel
- Click ‘Process’
- Go to Aggregation and select ‘Project’ field as the ‘Group by’ value
- Click ‘Process’
- Go to Dashboard and select the following options:
- Bar chart
- Display each group as separate series
- Category: AssignedTo
- Value: ID
- Aggregate over category
- Unit: fit
- Step: auto
- Function: count
- Save the chart and this is what we see:
The code
The code is exactly the same as for the previous use case, except the places colored red:
// ...
handlers.requestSuccess = function (data, logger) {
var dfd = $.Deferred();
var projectList = data.items;
data.items = [];
var deferreds = [];
var query = new SP.CamlQuery('<View> <ViewFields>' +
'<FieldRef Name="AssignedTo"/> <FieldRef Name="ID"/>' +
'</ViewFields> <Query/> <Aggregations Value="Off"/>' +
'<RowLimit Paged="TRUE">10000</RowLimit> </View>');
for (var project in projectList) {
var d = request(query, projectList[project],
'Task List', ['ID', 'AssignedTo'], data);
deferreds.push(d);
}
console.log('All requests fired.');
$.when.apply(null, deferreds).done(function () {
console.log('All requests have been resolved.');
dfd.resolve();
});
return dfd.promise();
}
// ...
function request(query, project, listName, fields, data) {
var dfd = $.Deferred();
var ctx = new SP.ClientContext(project['URL']);
var list = ctx.get_web().get_lists().getByTitle(listName);
var itemCollection = list.getItems(query);
ctx.load(itemCollection, 'Include(' + fields.join(',') + ')');
ctx.executeQueryAsync(function () {
var itemCollectionEnumerator = itemCollection.getEnumerator();
while (itemCollectionEnumerator.moveNext()) {
var listItem = itemCollectionEnumerator.get_current();
var item = {};
$.each(fields, function () {
try {
var value = listItem.get_item(this);
if (this == 'AssignedTo' && value) {
item[this] =
value[0].get_lookupValue().replace(/\/, '\');
}
else {
item[this] = value;
}
} catch (e) { }
});
item['Project'] = project['Title'];
data.items.push(item);
}
console.log('Request to ' +
project['URL'] + ' has been resolved.');
dfd.resolve();
}, function (caller, args) {
console.log('Error: ' + args.get_message());
});
return dfd.promise();
}The difference with the first use case is that we’re using different fields. Besides using new names for the fields we are also retrieving the lookup values of AssignedTo fields, which are the names of our employees.
Summary
What I hope I’ve illustrated with this post is that you can (and how you can) utilize the handler methods to retrieve additional data, including data from other sites, insert it into the data object and use that data to you construct your chart.