Charts for SharePoint 2010 WSP Installation
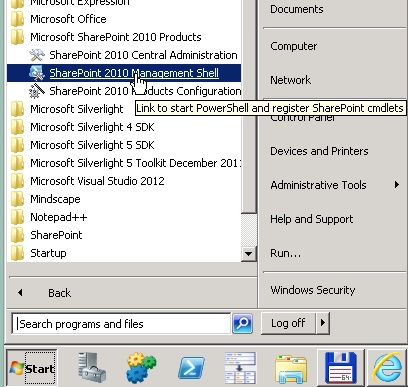
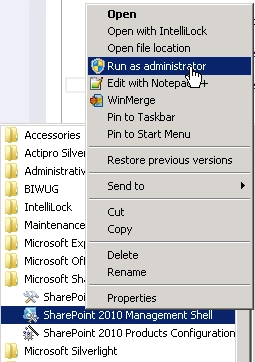
Download wsp-package and upload it to one of the servers in your SharePoint 2010 farm. Run Sharepoint 2010 Management Shell as administrator:
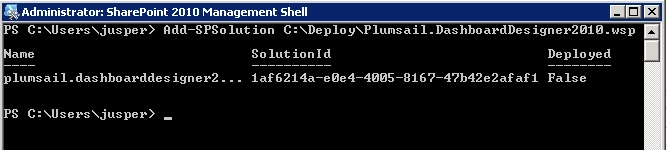
Execute the following command: Add-SPSolution
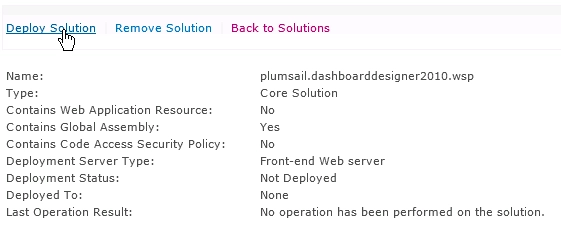
Go to Central Administration → System Settings → Manage farm solutions. Choose plumsail.dashboarddesigner2010.wsp and click the Deploy Solution link:
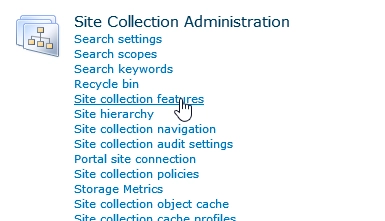
Navigate to the site collection where you’re going to use the Charts, open the Site Settings page, click the Site collection features link under the Site Collection Administration section:
Activate the Charts feature:

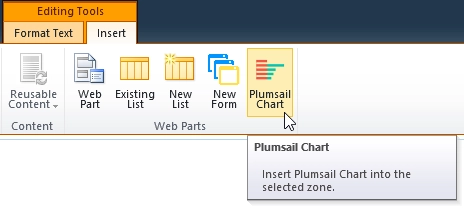
Now, open any page where you want to add a chart, switch it into the edit mode and click the Plumsail Chart button on the ribbon to add a chart under the cursor or into the selected web part zone: