
Navigate over data by using draggable charts
Demo
Configuration
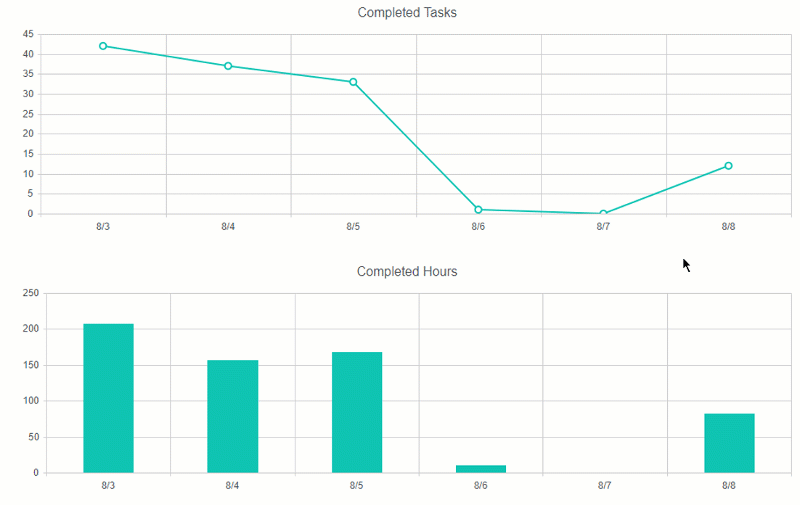
In this article I will demonstrate how to configure navigation over data by dragging a SharePoint chart created with Charts using the mouse or swipe gestures. For instance, I’ve created a chart that displays number of completed tasks per day. If the project lasts for long, it can be difficult to display all the data at once. As the solution I will display data for last 6 days only and allow users to swipe the chart to view other time periods.
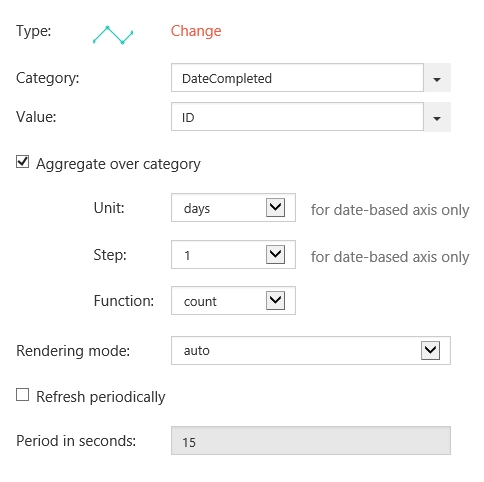
I designed a line chart with aggregation over DateCompleted column:
Ok, now we need to switch to Dashboard → Advanced tab to make the chart draggable. Here we have to define visibility range and implement drag handler following way:
var handlers = {};
handlers.preRender = function(config, logger) {
    var data = config.series[0].data;

    // Maximum value of category axis
    var maxDate = data[data.length - 1].DateCompleted;

    // Minimum value of category axis
    var minDate = data[0].DateCompleted;

    // Range of visible data (in days)
    var range = 5;

    var endDate = new Date(data[data.length - 1].DateCompleted.getTime());
    var startDate = new Date(endDate.getTime());
    startDate.setDate(startDate.getDate() - range);

    config.categoryAxis.min = startDate;
    config.categoryAxis.max = endDate;
    config.drag = function (e) {
        e.originalEvent.preventDefault();

        var chart = e.sender;
        var delta = Math.round(e.originalEvent.x.initialDelta / 100);
        console.log(delta);

        if (delta != 0) {

        startDate.setDate(startDate.getDate() - delta * 2);
        endDate.setDate(endDate.getDate() - delta * 2);

        if (startDate < minDate) {
            startDate = new Date(minDate.getTime());
            endDate = new Date(startDate.getTime());
            endDate.setDate(endDate.getDate() + range);
        }

        if (endDate > maxDate) {
            endDate = new Date(maxDate.getTime());;
            startDate = new Date(endDate.getTime());
            startDate.setDate(startDate.getDate() - range);
        }
        }

        chart.options.categoryAxis.min = startDate;
        chart.options.categoryAxis.max = endDate;
        chart.options.transitions = false;
        chart.redraw();
    }

    window.config = config;

    return true;
}
At the beginning of preRender handler I defined three constants: maxDate, minDate, and range. maxDate is a maximum value of the category axis. minDate is a minimum value of the category axis. Please, note that I assigned the last and the first items of the data set to these variables accordingly. It works only if you sorted the data by category axis field, for instance, in the CAML-query:
<View>
    <Query>
        <OrderBy>
        <FieldRef Name="DateCompleted" />
        </OrderBy>
        …
    </Query>
    …
</View
Range is the number of days in the visible part of the chart. That’s it. Now users will be able to drag the chart to navigate through the data.