Link chart to a SharePoint list
Demo
Configuration
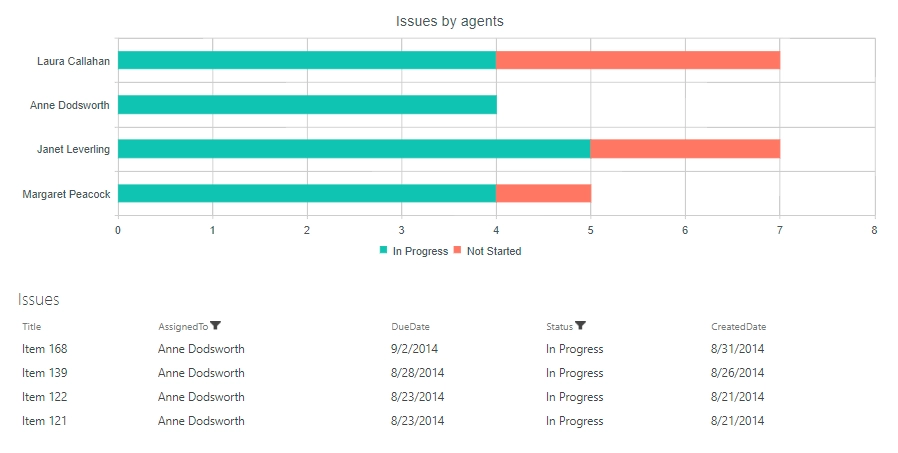
In this example I’ve created a chart based on the Issues list.
I grouped data by Assigned To field on Data Source → Aggregate tabs and by Status field on Dashboard → Chart tab.
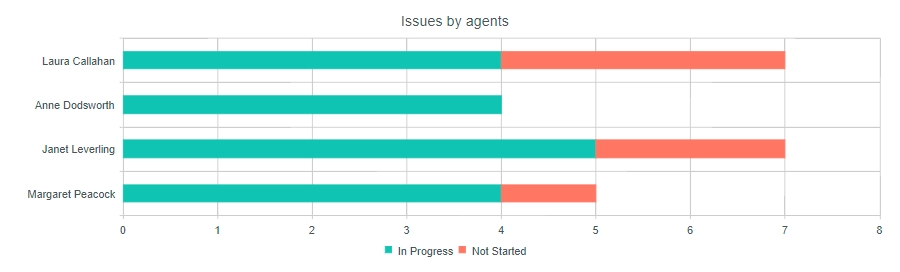
Here is the result:
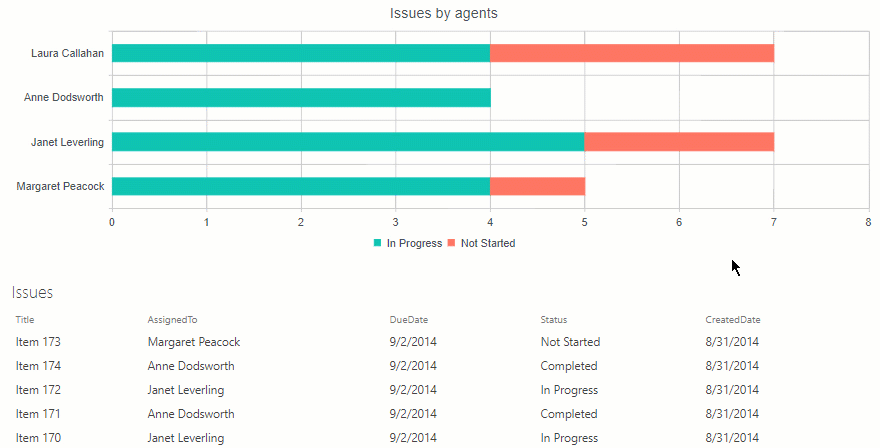
Under the chart I put the list of issues. Now I want to filter the list by clicking series in the chart. Say, if a user clicks green (In Progress) series of Anne Dodsworth, the list has to display only ‘In Progress’ issues that are assigned to Anne Dodsworth.
First, I will introduce to you how filtration of SharePoint 2013 lists works. A list view tracks changes of a hash part of a URL that contains filtering and sorting properties of a particular view on the current page. Controls above the list, that are in charge of sorting and filtering, just modify the hash in accordance with the following format:
#InplviewHash{ViewId}=FilterField1={Field1}-FilterValue1={Value1}-FilterField2={Field2}-FilterValue2={Value2}
We will generate this hash in our chart via JavaScript based on user actions. First, you need to obtain Id of the view. You can filter your list by using column headers and copy the view Id directly from the query string. Also, you can use ctx JavaScript variable that contains configuration of the lastly added view. If you have multiple views on the page, you’d better use the first approach. If you have a single view on the page, use ctx variable as I do below to avoid hardcoded GUIDs in your code.
Now, open the chart in Charts and switch to Dashboard → Advanced tab. Insert the following code here:
var handlers = {};
handlers.preRender = function (config, logger) {
    logger.debug('Configuration: ', config);

    var filtrationApplied = false;

    config.plotAreaClick = function (e) {
        if (!filtrationApplied) {
            window.location.hash = '';
        }

        filtrationApplied = false;
    }

    config.seriesClick = function (e) {
        if (ctx && ctx.clvp) {
            var filter =
            'FilterField1=AssignedTo-FilterValue1=' + e.dataItem.__proto__.AssignedTo
            + '-' + 'FilterField2=Status-FilterValue2=' + e.dataItem.__proto__.Status;

            window.location.hash = 'InplviewHash' +
            ctx.clvp.wpid + '=' + encodeURIComponent(filter);

            filtrationApplied = true;
        }
    }

    return true;
}
As you can see, here I defined two handlers which are executed when a user clicks a specific series or the plot area. If a user clicks the chart area that doesn’t contain series, the filtration resets. As mentioned above, ctx.clvp.wpid contains Id of the lastly added view. If you have multiple view on your page, you should replace this variable with Id of a particular view. Here is the demo, quite easy, isn’t it?