
HelpDesk Dashboard
Dashboard
Data

Configuration
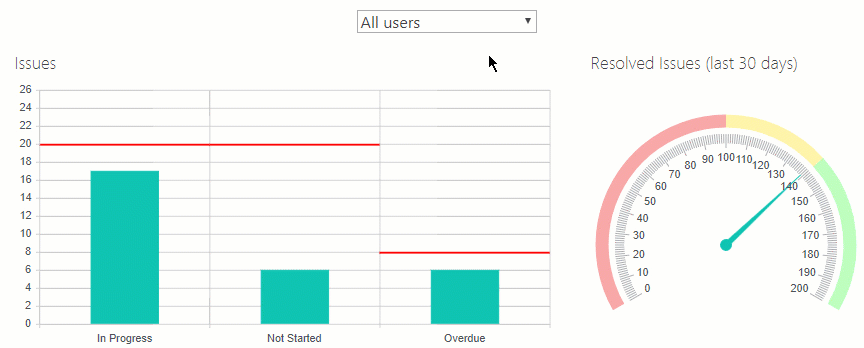
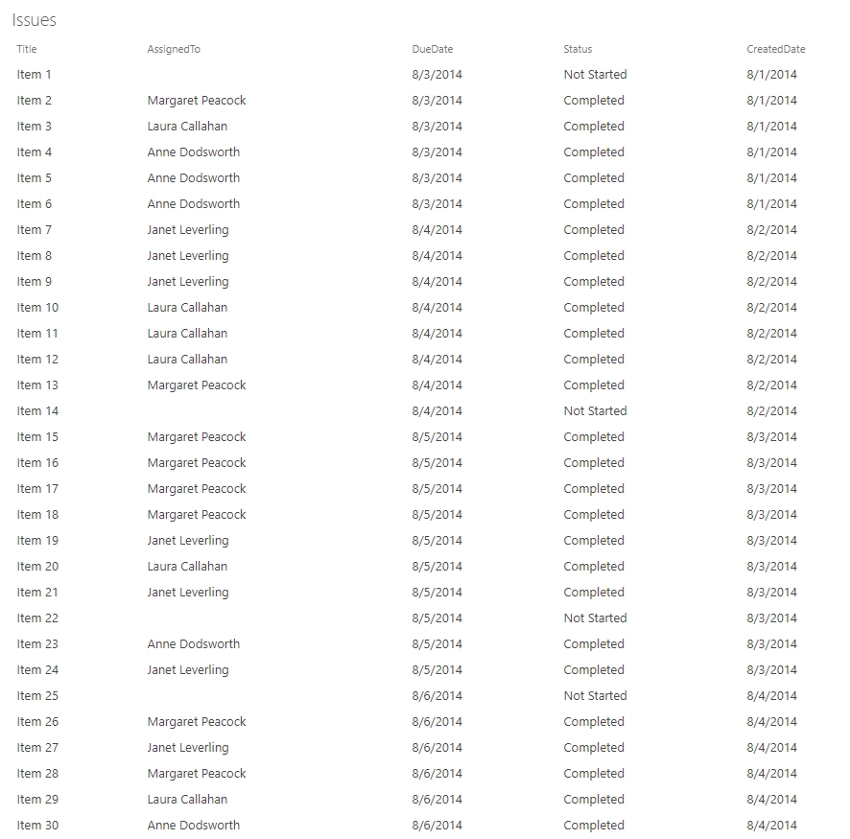
Issues
Displays opened issues of the selected user categorized by their statuses.
Data Source
SharePoint List
List: Issues
Fields: Assigned To, Due Date, StatusCAML:
<View>
    <Query>
        <Where>
        <And>
            {Filter}
            <IsNotNull>
            <FieldRef Name="AssignedTo" />
            </IsNotNull>
        </And>
        </Where>
        <OrderBy>
        <FieldRef Name="ID" />
        </OrderBy>
    </Query>
    <ViewFields>
        <FieldRef Name="LinkTitle" />
        <FieldRef Name="AssignedTo" />
        <FieldRef Name="Status" />
        <FieldRef Name="DueDate" />
    </ViewFields>
    <RowLimit Paged="TRUE">1000</RowLimit>
</View>
The {Filter} token is replaced with a clause via JavaScript in requestInit handler.
Aggregation:
Group by: StatusAggregations:
Count = count of StatusAdvanced:
var handlers = {};
handlers.requestInit = function (query, logger) {
    var view = query.get_viewXml();

    var userId = $('#helpdesk-agents').val();

    if (userId && userId !== '0') {
        view = view.replace('{Filter}', '<And>    <Eq>        <FieldRef Name ="AssignedTo" LookupId="true" />        <Value Type="Lookup">' + userId + '</Value>    </Eq>    <Neq>        <FieldRef Name ="Status" />        <Value Type="Text">Completed</Value>    </Neq>    </And>');
    } else {

        view = view.replace('{Filter}', '<Neq>        <FieldRef Name ="Status" />        <Value Type="Text">Completed</Value>    </Neq>');
    }

    logger.info(view);
    query.set_viewXml(view);

    return true;
}

handlers.requestSuccess = function (data, logger) {
    populateAgents(data);
    populateOverdueIssues(data);
    return true;
}

handlers.aggregationSuccess = function (data, logger) {
    $.each(data.groups, function () {

        var userId = $('#helpdesk-agents').val();

        switch (this.value) {
            case 'Overdue':
                if (userId && userId !== '0') {
                    this.Target = 2;
                } else {
                    this.Target = 8;
                }
                break;
            case 'Not Started':
                if (userId && userId !== '0') {
                    this.Target = 5;
                } else {
                    this.Target = 20;
                }
                break;
            case 'In Progress':
                if (userId && userId !== '0') {
                    this.Target = 5;
                } else {
                    this.Target = 20;
                }
                break;
        }
    });
    return true;
}

handlers.finish = function (data, logger, processor, el) {
    logger.debug('Data is processed: ', data);

    if (processor && !processor.subscribed) {
        $('#helpdesk-agents').change(function () {
            el.html('<img alt="loading..." src="/_layouts/15/images/gears_anv4.gif" />');
            processor.process(el);
        });

        processor.subscribed = true;
    }

    return true;
}

function populateAgents(data) {
    if ($('#helpdesk-agents option').length == 1) {
        var agents = {};

        $.each(data.items, function () {
            if (!agents[this.AssignedToId]) {
                agents[this.AssignedToId] = this.AssignedTo;
            }
        });

        for (var key in agents) {
            $('#helpdesk-agents').append($('<option></option>')
                .attr('value', key)
                .text(agents[key]));
        }
    }
}

function populateOverdueIssues(data) {
    var overdueIssues = [];
    $.each(data.items, function () {
        if (this.DueDate > new Date(2014, 07, 30)) {
            overdueIssues.push({
                Status: 'Overdue',
                AssignedTo: this.AssignedTo
            });
        }
    });

    data.items = data.items.concat(overdueIssues);
}
In the requestInit handler we replace the ‘{Filter}’ token with clause to retrieve the issues assigned to the selected user only or all issues if the selected option is ‘All Users’. In the requestSuccess handler we populate drop-down filter above the charts with users and add overdue issues based on the DueDate field to the data. In the aggregationSuccess handler we define threshold value for each status. And finally, in the finish handler we subscribe on the filter change event to rebuild the chart based on a new value.
Dashboard
Chart
Type: Vertical Bullet
Display each group as a separate series: False
Category: value
Value: Count
Target: Target
Aggregate over category: False
Resolved Issues (last 30 days)
Displays resolved issues by the selected user over the last 30 days.
Data Source
SharePoint List
List: Issues
Fields: Assigned To, Due DateCAML:
<View>
    <Query>
        <Where>
        <And>
            <Geq>
            <FieldRef Name="Created" />
            <Value Type="DateTime">
                <Today OffsetDays="-30" />
            </Value>
            </Geq>{Filter}
        </And>
        </Where>
        <OrderBy>
        <FieldRef Name="ID" />
        </OrderBy>
    </Query>
    <ViewFields>
        <FieldRef Name="LinkTitle" />
        <FieldRef Name="AssignedTo" />
        <FieldRef Name="DueDate" />
        <FieldRef Name="CreatedDate" />
    </ViewFields>
    <RowLimit Paged="TRUE">1000</RowLimit>
</View>
Aggregation:
Group by: emptyAs you can see the empty field doesn’t exists in the data source. We use it here to calculate aggregate values over all rows in the data set because for each row it equals to “undefined”, thus we get a single group containing all items.
Aggregations:
Count = count of DueDateAdvanced:
var handlers = {};

handlers.requestInit = function (query, logger) {
    var view = query.get_viewXml();

    var userId = $('#helpdesk-agents').val();

    if (userId && userId !== '0') {

        view = view.replace('{Filter}', '<And>    <Eq>        <FieldRef Name ="AssignedTo" LookupId="true" />        <Value Type="Lookup">' + userId + '</Value>    </Eq>    <Eq>        <FieldRef Name ="Status" />        <Value Type="Text">Completed</Value>    </Eq>    </And>');
    } else {

        view = view.replace('{Filter}', '<Eq>        <FieldRef Name ="Status" />        <Value Type="Text">Completed</Value>    </Eq>');
    }

    logger.info(view);
    query.set_viewXml(view);

    return true;
}

handlers.finish = function (data, logger, processor, el) {
    logger.debug('Data is processed: ', data);

    if (processor && !processor.subscribed) {
        $('#helpdesk-agents').change(function () {
            el.html('<img alt="loading..." src="/_layouts/15/images/gears_anv4.gif" />');
            processor.process(el);
        });

        processor.subscribed = true;
    }

    return true;
}
In the requestInit handler we replace the ‘{Filter}’ token with clause to retrieve the issues assigned to the selected user only or all issues if the selected option is ‘All Users’. In the finish handler we subscribe on the filter change event to rebuild the chart based on a new value.
Dashboard
Chart
Type: Radar Gauge
Value: CountAdvanced:
var handlers = {};
handlers.preRender = function (config, logger) {
    logger.debug('Configuration: ', config);

    window.config = config;
    var userId = $('#helpdesk-agents').val();
    if (!userId || userId === '0') {
        config.scale.max = 200;

        config.scale.ranges[0].from = 140;
        config.scale.ranges[0].to = 200;

        config.scale.ranges[1].from = 100;
        config.scale.ranges[1].to = 140;

        config.scale.ranges[2].from = 0;
        config.scale.ranges[2].to = 100;

    }

    return true;
}
Here we specify qualitative ranges of performance for all users. By default, they are defined for a single user.
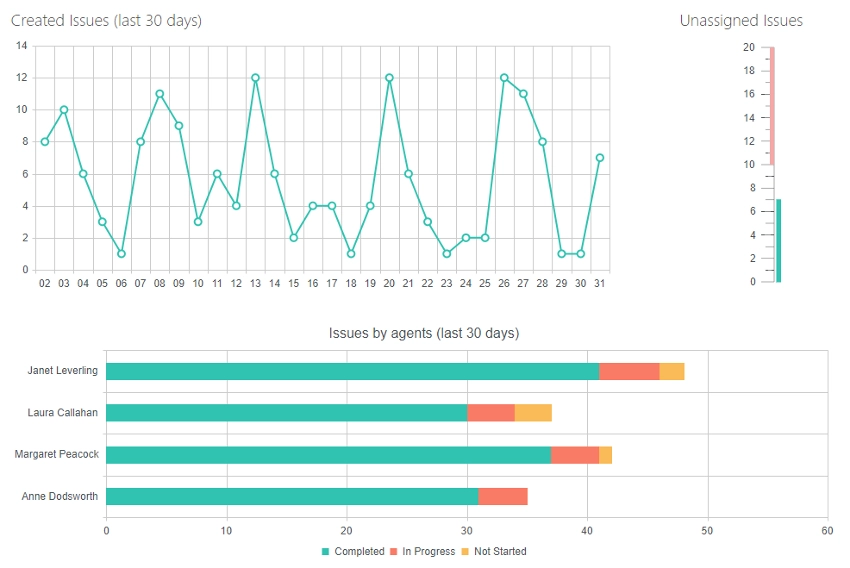
Created Issues (last 30 days)
Displays issues created over the last 30 days.
Data Source
SharePoint List
List: Issues
Fields: CreatedCAML:
<View>
    <Query>
        <OrderBy>
        <FieldRef Name="ID" />
        </OrderBy>
        <Where>
        <Geq>
            <FieldRef Name="Created" />
            <Value Type="DateTime">
            <Today OffsetDays="-30" />
            </Value>
        </Geq>
        </Where>
    </Query>
    <ViewFields>
        <FieldRef Name="LinkTitle" />
        <FieldRef Name="Created" />
    </ViewFields>
    <RowLimit Paged="TRUE">1000</RowLimit>
</View>
Dashboard
Chart
Type: Line
Category: Created
Value: Created
Aggregate over category: True
Unit: daysStep: 1Function: countStyle
Category Axis:Label format: {0:dd}
Unassigned Issues
Displays unassigned tasks.
Data Source
SharePoint List
List: Issues
Fields: CreatedCAML:
<View>
    <Query>
        <OrderBy>
        <FieldRef Name="ID" />
        </OrderBy>
        <Where>
        <IsNull>
            <FieldRef Name="AssignedTo" />
        </IsNull>
        </Where>
    </Query>
    <ViewFields>
        <FieldRef Name="LinkTitle" />
        <FieldRef Name="AssignedTo" />
    </ViewFields>
    <RowLimit Paged="TRUE">1000</RowLimit>
</View>
Aggregation:
Group by: emptyAs you can see the empty field doesn’t exists in the data source. We use it here to calculate aggregate values over all rows in the data set because for each row it equals to “undefined”, thus we get a single group containing all items.
Aggregations:
Count = count of AssignedTo
Dashboard
Chart
Type: Linear Gauge
Value: Count
Issues by agents (last 30 days)
Displays issues created over the last 30 days categorized by users and statuses.
Data Source
SharePoint List
List: Issues
Fields: Assigned To, StatusCAML:
<View>
    <Query>
        <OrderBy>
        <FieldRef Name="ID" />
        </OrderBy>
        <Where>
        <And>
            <Geq>
            <FieldRef Name="Created" />
            <Value Type="DateTime">
                <Today OffsetDays="-30" />
            </Value>
            </Geq>
            <IsNotNull>
            <FieldRef Name="AssignedTo" />
            </IsNotNull>
        </And>
        </Where>
    </Query>
    <ViewFields>
        <FieldRef Name="AssignedTo" />
        <FieldRef Name="Status" />
    </ViewFields>
    <RowLimit Paged="TRUE">1000</RowLimit>
</View>
Aggregation:
Group by: Status
Dashboard
Chart
Type: Bar
Display each group as a separate series: True
Category: Assigned To
Value: Assigned To
Aggregate over category: True
Function: countStyle
Series:Stack series: True