
Create a Floor Plan for SharePoint and Office365
Floor Plan with Charts for SharePoint and Microsoft 365
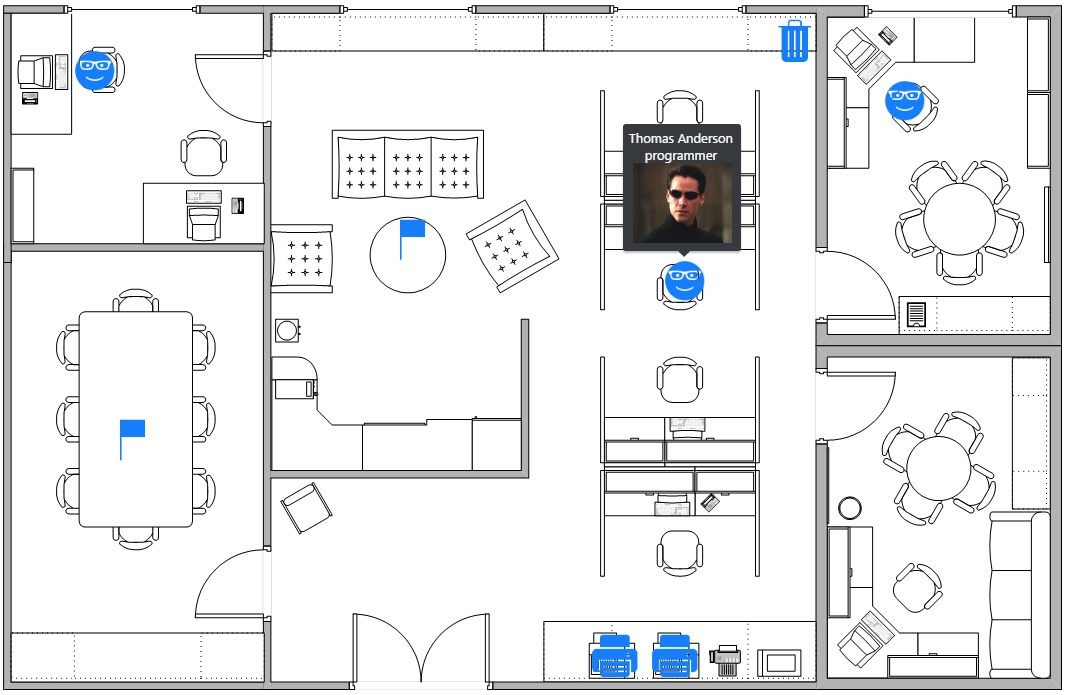
Here is a sample of the floor plan built from a SharePoint list with the help of Charts:
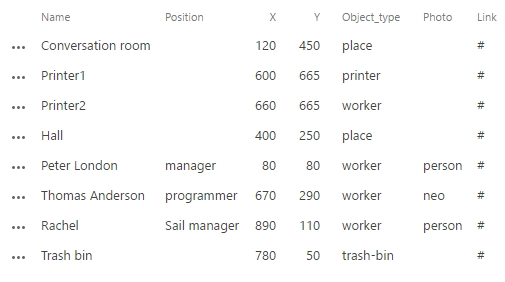
To implement this case, we created a list as below and used Map with Markers chart in Charts:
If you do not want to store data in a list, you can inject it directly into your chart in Data source → Advanced tab. In this case leave Data Source → SharePoint List empty.
handlers.init = function (data, logger) {
    data.items = [
    {
        Name: 'Conversation room',
        Position: '',
        Photo: "",
        Y: 450,
        X: 120,
        Object_type: 'place',
        Link: "#"
    }, {
        Name: 'Printer1',
        Position: '',
        Photo: "",
        Y: 665,
        X: 600,
        Object_type: 'printer',
        Link: "#"
    }, {
        Name: 'Printer2',
        Position: '',
        Photo: "",
        Y: 665,
        X: 660,
        Object_type: 'printer',
        Link: "#"
    }, {
        Name: 'Hall',
        Position: '',
        Photo: "",
        Y: 250,
        X: 400,
        Object_type: 'place',
        Link: "#"
    }, {
        Name: 'Peter London',
        Position: "manager",
        Photo: "person",
        Y: 80,
        X: 80,
        Object_type: 'worker',
        Link: "#"
    }, {
        Name: 'Thomas Anderson',
        Position: "programmer",
        Photo: "neo",
        Y: 290,
        X: 670,
        Object_type: 'worker',
        Link: "#"
    }, {
        Name: 'Rachel',
        Position: "Sail manager",
        Photo: "person",
        Y: 110,
        X: 890,
        Object_type: 'worker',
        Link: "#"
    }, {
        Name: 'Trash',
        Position: "Main trash bin",
        Photo: "",
        Y: 50,
        X: 780,
        Object_type: 'trash-bin',
        Link: "#"
    }];
}
Here I showed an example of data for objects on the floor plan. You should use own data with similar structure.
All the coordinates are specified in pixels down from the upper left corner of the plan.
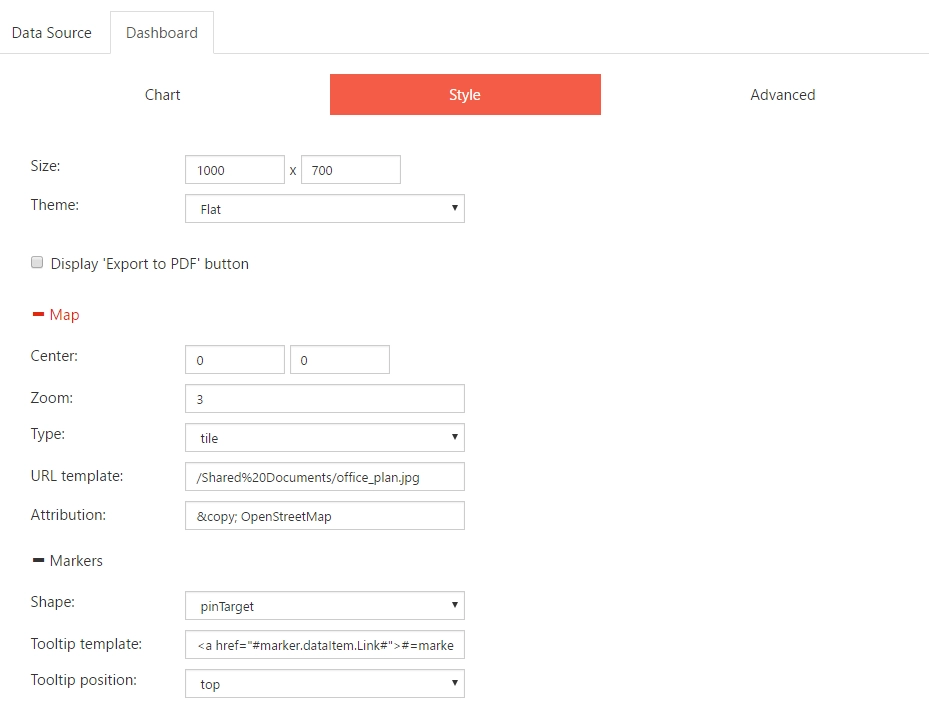
Now, pick ‘Map with markers’ chart type in the Dashboard → Chart and navigate to Dashboard → Style. Set fixed size, say 1000 x 700. Expand Map section, set Type in ‘tile’ and fill URL template with the address of your office map image. Finally, set tooltip template, in our sample it looks like this:
<a href="#marker.dataItem.Link#">#=marker.dataItem.Name#</a> <br/>#=marker.dataItem.Position#<br/><img src="/DashboardDesignerAppLib/Photos/#=marker.dataItem.Photo#.jpg" alt="Photo"/>
Pay attention to marker.dataItem.fieldName injections in the snippet. The fieldName must literally match to the appropriate field name in the source of data.
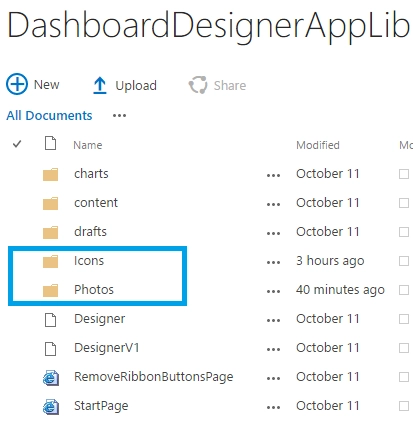
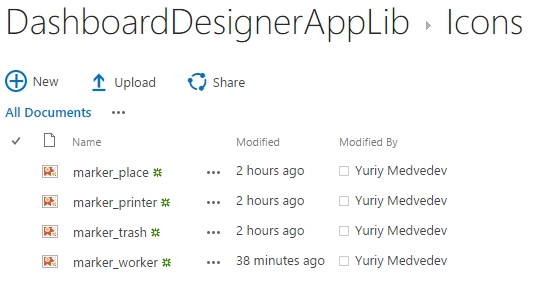
Now, we need to upload images for all marker types and employee photos. I used ‘~site/DashboardDesignerAppLib/’ library and created directories /Icons/ and /Photos/.
Into Icons folder, I uploaded images for markers with the following names: ‘marker_Object_type.webp’ (replace Object_type with the corresponding type from the source data). And into Photos folder, I put employees’ photos. Each filename corresponds to the Photo field of the source of data.
To adjust the map chart to fixed floor plan and remove unnecessary navigation controls, put the below into Dashboard → Advanced tab:
var handlers = {};
handlers.preRender = function (config, logger, proc, el) {
    var planWidth = 1059;
    var planHeight = 685;

    $('<style type="text/css">        #' + el.attr('id') + ' .km-scroll-container:before{            content: url("'+ config.map.layers[0].urlTemplate + '");    }</style>').appendTo('head');

    $.extend(config.map, {
        markerCreated: function (e) {
            var loc = e.sender.viewToLocation(e.marker.options.location);
            e.marker.options.location = [loc.lat, loc.lng];
        },
        markerActivate: function (e) {
            e.marker.element.css({
                background: "url(/DashboardDesignerAppLib/Icons/marker_" + e.marker.dataItem.Object_type + ".webp) no-repeat",
                "background-size": "50px",
                width: "50px",
                height: "50px",
            });
        },
        reset: function (e) {
            e.sender.scroller.dimensions.x._virtualMin = 0;
            e.sender.scroller.dimensions.x._virtualMax = planWidth;

            e.sender.scroller.dimensions.y._virtualMin = 0;
            e.sender.scroller.dimensions.y._virtualMax = planHeight;
        },
        zoomable: false,
        controls: {
            attribution: false,
            navigator: false,
            zoom: false,
        },
    });

    config.map.layers[0].type = 'shape';

    return true;
}
In the code above, set planWidth, planHeight variables in width and height of your floor map image are and check all URLs.