
CEO Dashboard
Dashboard
Revenue distribution by category and country
Revenue distribution by category and customer
Data
Configuration
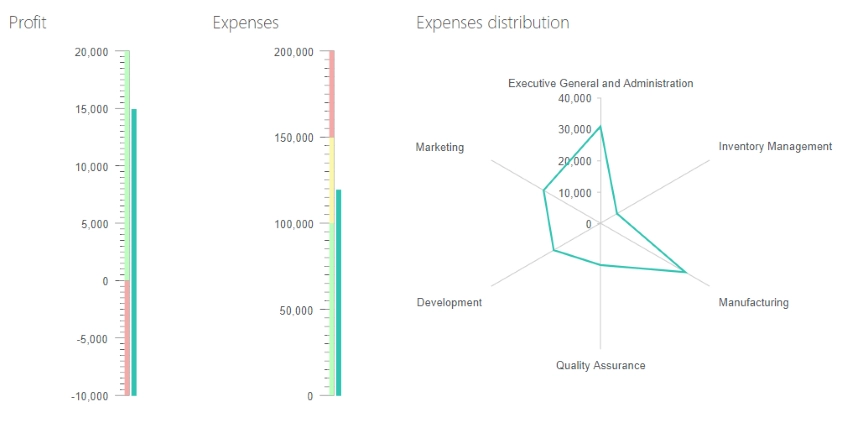
Profit
Displays total profit calculated by formula: total revenue minus corporate expenses.
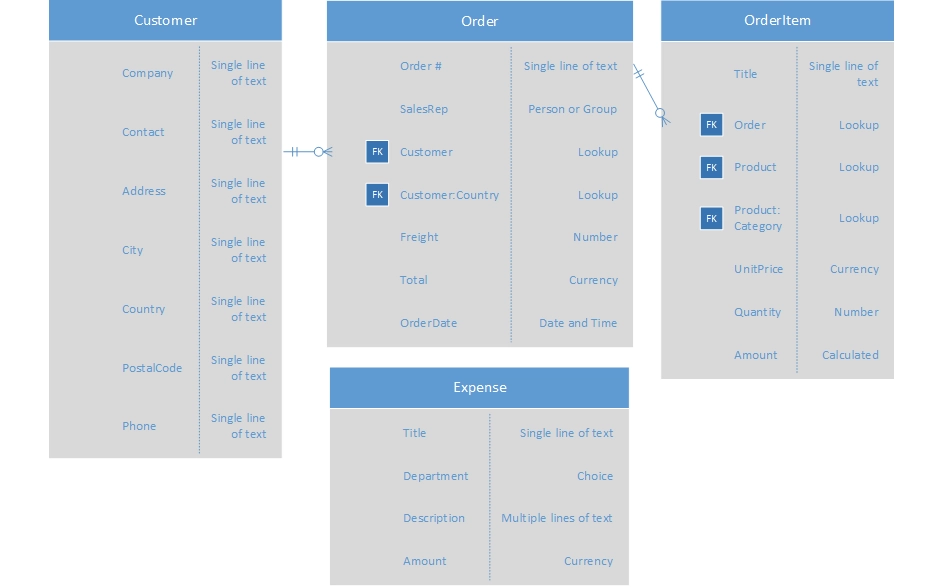
Data Source
SharePoint List
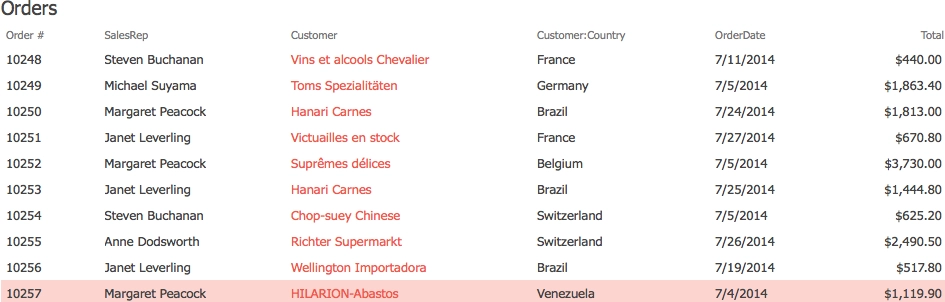
List: Orders
Fields: Total- Aggregation:
Group by: empty - As you can see the empty field doesn’t exists in the data source. We use it here to calculate aggregate values over all rows in the data set because for each row it equals to “undefined”, thus we get a single group containing all items.
- Aggregations:
Total = sum of Total - Advanced:
var handlers = {}; handlers.aggregationSuccess = function (data, logger) { return window.expensesPopulation.done(function (expenses) { data.groups[0].Total = data.groups[0].Total - expenses; }) } - Object expensesPopulation is a Deferred object defined in the Expenses chart that calculates total expenses over the Expenses list. It resolves the object when the calculation is done. Next, we take it from the total revenue to get the profit.
Dashboard
Chart
Type: Linear Gauge
Value: Total
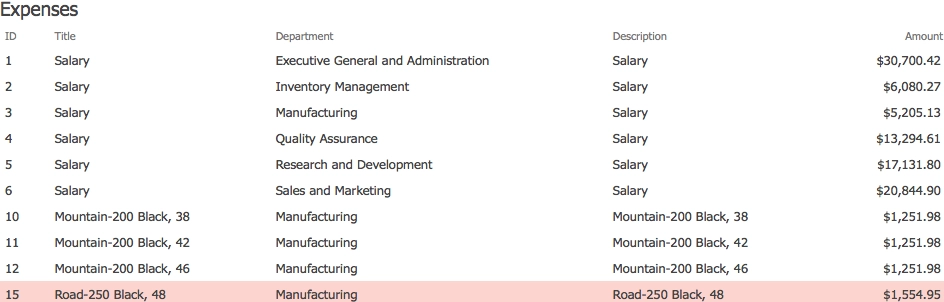
Expenses
Calculates and displays total expenses.
Data Source
SharePoint List
List: Expenses
Fields: Amount- Aggregation:
Group by: empty - As you can see the empty field doesn’t exists in the data source. We use it here to calculate aggregate values over all rows in the data set because for each row it equals to “undefined”, thus we get a single group containing all items.
- Aggregations:
Total = sum of Amount - Advanced:
var handlers = {}; handlers.init = function (data, logger) { window.expensesPopulation = window.expensesPopulation || $.Deferred(); return true; } handlers.aggregationSuccess = function (data, logger) { expensesPopulation.resolve(data.groups[0].Total); return true; } - Deferred object expensesPopulation notifies that the calculation of the total expenses is done and passes the aggregate value to the subscribers. This object is used by the Profit chart to calculate profit by revenue and expenses.
Dashboard
Chart
Type: Linear Gauge
Value: Total
Expenses Distribution
Displays expenses of each department using Radar Line chart.
Data Source
SharePoint List
List: Expenses
Fields: Amount, Department- Aggregation:
Group by: Department - Aggregations:
Total = sum of Amount
Dashboard
Chart
Type: Radar line
Display each group as a separate series: False
Category: value
Value: Total
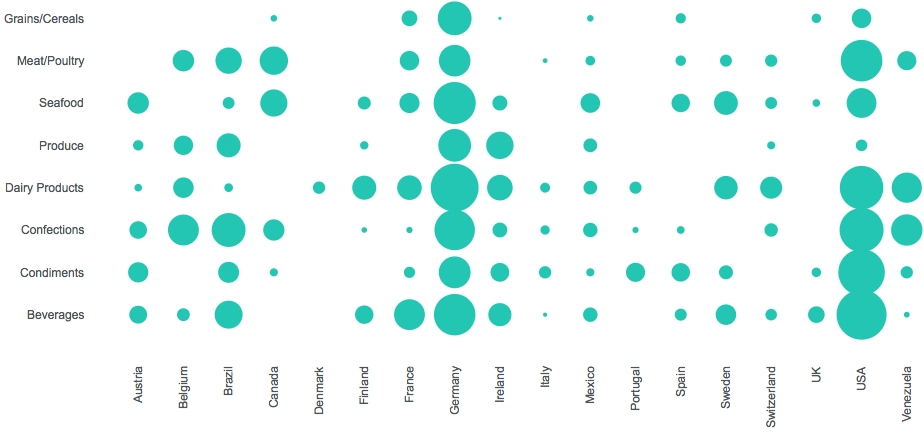
Revenue distribution by category and country
Calculates and displays total revenue by category and country using Bubble chart.
Data Source
SharePoint List
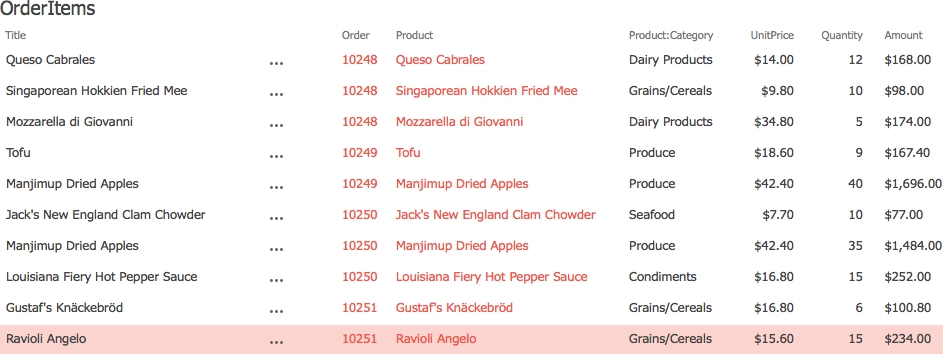
List: OrderItems
Fields: Amount, Product:Category- CAML:
<View>
    <Query>
        <OrderBy>
        <FieldRef Name="ID" />
        </OrderBy>
    </Query>
    <ViewFields>
        <FieldRef Name="LinkTitle" />
        <FieldRef Name="Amount" />
        <FieldRef Name="Product_x003a_Category" />
        <FieldRef Name="Country" />
    </ViewFields>
    <ProjectedFields>
        <Field Name='Country' Type='Lookup' List='Customers' ShowField='Country' />
    </ProjectedFields>
    <Joins>
        <Join Type='INNER' ListAlias='Orders'>
        <Eq>
            <FieldRef Name='Order0' RefType='Id' />
            <FieldRef List='Orders' Name='ID' />
        </Eq>
        </Join>
        <Join Type='INNER' ListAlias='Customers'>
        <Eq>
            <FieldRef List='Orders' Name='Customer' RefType='Id' />
            <FieldRef List='Customers' Name='ID' />
        </Eq>
        </Join>
    </Joins>
    <RowLimit Paged="TRUE">1000</RowLimit>
</View>
We need to join the original list with the Orders and the Customers to retrieve the Country field from the Customers list. Please, note, that we should add the following line of JavaScript code in init handler to obtain an additional field from the joined list:
model.fields.push(‘Name’); - Aggregation:
Group by: GroupBy - The GroupBy field is defined in requestSuccess JavaScript handler by concatenating the Country and the Category fields to create a unique value for each pair of values of these fields.
- Aggregations:
Total = sum of Amount - Advanced:
var handlers = {};
handlers.init = function (data, logger, processor, el, model) {
    // add Category field to model
    model.fields.push('Country');
    return true;
}

handlers.requestSuccess = function (data, logger) {
    // Add group by field
    $.each(data.items, function () {
        this.GroupBy = this.Product_x003a_Category + '_' + this.Country;
    });
    return true;
}

handlers.aggregationSuccess = function (data, logger) {
    var categories = [];
    var countries = [];
    window.getCategoryByIndex = function (id) {
        return categories[id] || '';
    }

    window.getCountryByIndex = function (id) {
        return countries[id] || '';
    }

    data.groups.sort(function (a, b) {
        return a.items[0].Country == b.items[0].Country ?
        (a.items[0].Product_x003a_Category > b.items[0].Product_x003a_Category ? 1 : -1) :
            (a.items[0].Country > b.items[0].Country ? 1 : -1)
    });

    $.each(data.groups, function () {
        var categoryIndex = $.inArray(this.items[0].Product_x003a_Category, categories);
        if (categoryIndex === -1) {
            categoryIndex = categories.length;
            categories.push(this.items[0].Product_x003a_Category);
        }

        var countryIndex = $.inArray(this.items[0].Country, countries);
        if (countryIndex === -1) {
            countryIndex = countries.length;
            countries.push(this.items[0].Country);
        }

        this.CategoryIndex = categoryIndex;
        this.CountryIndex = countryIndex;
    });
    return true;
}
Bubble chart requires numerical values for both X and Y axes that is why we should define additional fields (CategoryIndex and CountryIndex) for each group to store indices of the categories and countries. In addition, we should define global functions (getCategoryByIndex and getCountryByIndex) to retrieve names of categories or countries by their indices for the chart labels.
Dashboard
Chart
Type: Bubble
X-axis: CountryIndex
Y-axis: CategoryIndex
Size field: Total- Style
Tooltips: Template: #= getCategoryByIndex(value.y) + ‘: $’ + kendo.toString(value.size, ‘n0’) # - X-axis: Label template: #= getCountryByIndex(value) #
- Y-axis: Label template: #= getCategoryByIndex(value) #
- Advanced:
var handlers = {};
handlers.preRender = function (config, logger) {
    config.xAxis.labels.rotation = -90;
    config.xAxis.line = {
        visible: false
    }

    config.yAxis.line = {
        visible: false
    }

    return true;
}
Here we rotate the X-axis labels and hide the plot lines by modifying the chart settings via JavaScript before rendering.
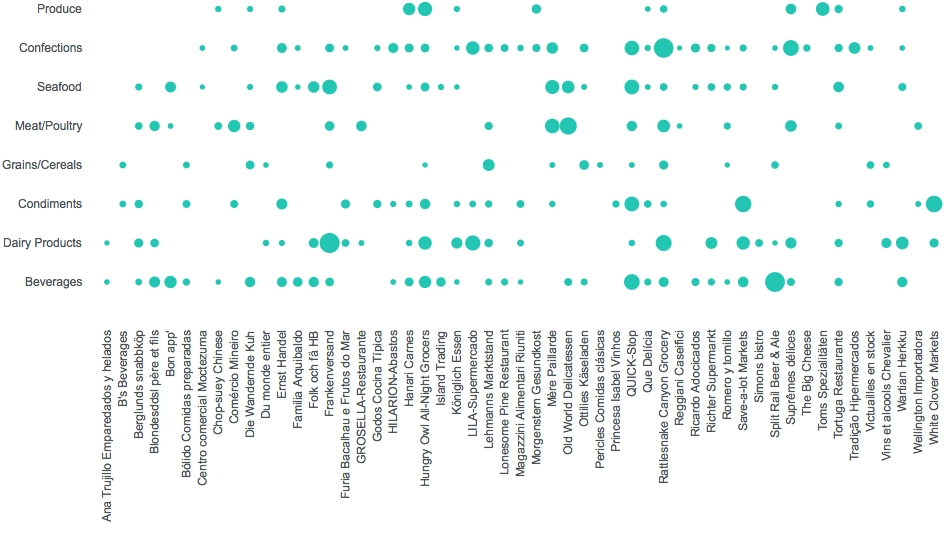
Revenue distribution by category and customer
Calculates and displays total revenue by category and country using Bubble chart.
Data Source
SharePoint List
List: OrderItems
Fields: Amount, Product:Category- CAML:
<View> <Query> <OrderBy> <FieldRef Name="ID" /> </OrderBy> </Query> <ViewFields> <FieldRef Name="LinkTitle" /> <FieldRef Name="Amount" /> <FieldRef Name="Product_x003a_Category" /> <FieldRef Name="Customer" /> </ViewFields> <ProjectedFields> <Field Type="Lookup" Name="Customer" ShowField="Title" List="Customers" /> </ProjectedFields> <Joins> <Join Type="INNER" ListAlias="Orders"> <Eq> <FieldRef Name="Order0" RefType="Id" /> <FieldRef Name="ID" List="Orders" /> </Eq> </Join> <Join Type="INNER" ListAlias="Customers"> <Eq> <FieldRef Name="Customer" List="Orders" RefType="Id" /> <FieldRef Name="ID" List="Customers" /> </Eq> </Join> </Joins> <RowLimit Paged="TRUE">1000</RowLimit> </View> - We need to join the original list with the Orders and the Customers to retrieve the Title field from the Customers list. Please, note, that we should add the following line of JavaScript code in init handler to obtain an additional field from the joined list:
model.fields.push(‘Name’); - Aggregation:
Group by: GroupBy - The GroupBy field is defined in requestSuccess JavaScript handler by concatenating the Customer and the Category fields to create a unique value for each pair of values of these fields.
- Aggregations:
Total = sum of Amount - Advanced:
var handlers = {};
handlers.init = function (data, logger, processor, el, model) {
    // add Category field to model
    model.fields.push('Customer');
    return true;
}

handlers.requestSuccess = function (data, logger) {
    // Add group by field
    $.each(data.items, function () {
        this.GroupBy = this.Product_x003a_Category + '_' + this.Customer;
    });
    return true;
}

handlers.aggregationSuccess = function (data, logger) {
    var categories = [];
    var customers = [];
    window.getCategoryByIndex1 = function (id) {
        return categories[id] || '';
    }

    window.getCustomerByIndex = function (id) {
        return customers[id] || '';
    }

    data.groups.sort(function (a, b) {
        return a.items[0].Customer == b.items[0].Customer ?
        (a.items[0].Product_x003a_Category > b.items[0].Product_x003a_Category ? 1 : -1) :
            (a.items[0].Customer > b.items[0].Customer ? 1 : -1)
    });

    $.each(data.groups, function () {
        var categoryIndex = $.inArray(this.items[0].Product_x003a_Category, categories);
        if (categoryIndex === -1) {
            categoryIndex = categories.length;
            categories.push(this.items[0].Product_x003a_Category);
        }

        var customerIndex = $.inArray(this.items[0].Customer, customers);
        if (customerIndex === -1) {
            customerIndex = customers.length;
            customers.push(this.items[0].Customer);
        }

        this.CategoryIndex = categoryIndex;
        this.CustomerIndex = customerIndex;
    });
    return true;
}
Bubble chart requires numerical values for both X and Y axes that is why we should define additional fields (CategoryIndex and CustomerIndex) for each group to store indices of the categories and customers. In addition, we should define global functions (getCategoryByIndex1 and getCustomerByIndex) to retrieve names of categories or customers by their indices for the chart labels.
Dashboard
Chart
Type: Bubble
X-axis: CustomerIndex
Y-axis: CategoryIndex
Size field: Total- Style
Tooltips: Template: #= getCustomerByIndex(value.x) + ‘: $’ + kendo.toString(value.size, ‘n0’) #
X-axis: Label template: #= getCustomerByIndex(value) #
Y-axis: Label template: #= getCategoryByIndex(value) # - Advanced:
var handlers = {};
handlers.preRender = function (config, logger) {
    config.xAxis.labels.rotation = -90;
    config.xAxis.line = {
        visible: false
    }

    config.yAxis.line = {
        visible: false
    }

    return true;
}
Here we rotate the X-axis labels and hide the plot lines by modifying the chart settings via JavaScript before rendering.