
Build Simple Charts – Maps with Geocoding API (SharePoint)
Latest article in our introduction article will show you how to work with map charts and how to send requests to public API when building a chart. If you haven’t read previous articles, I recommend you to check them out – how to build sales charts, demographics charts, and HelpDesk tags charts. In this article, we'll be using Google Maps’ Geocoding API. If you plan to use the same API, you’ll need to Get API Key first. As for the List, I’ll be using my list from the previous clients demographics article, but I’ve added a new Single Line Column to it – Address, which stores full address of each client. The List also has Country article which contains the Country where the customer lives. Let’s get right into it!
Map Markers Chart
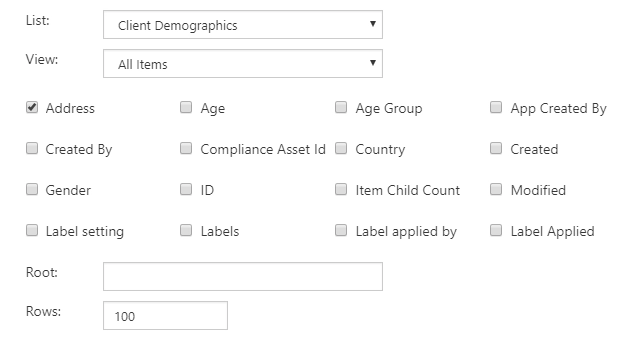
Our first chart will show us the exact address of our clients on the map and will allow us to see client distribution between countries and cities. After adding Charts Web Part to the page, we configure its Data Source. In SharePoint List tab we just need to select Client Demographics list, get Address from it and expand amount of Rows to select all the rows in the list:
Now, we can skip Aggregation tab and go straight to Data Source – Advanced tab. We’ll add the getLocations() function before everything else in the Data Source – Advanced tab. This function will be used to initialize geocoder and send requests to Google Maps Geocoding API. Since there is a quota on how many requests can be sent at the time, we’ll use timeouts in our code to slow down the rate at which the requests are sent. Depending on your personal quotas and the API you use, you might not need to use the delay at all or it can be drastically reduced. Each request will contain Address property taken from List Items. Upon success, you’ll get the location of the address, including Latitude and Longitude which we need to build the map chart. These properties will be added to data.items, so they are available when building the chart. We add the following code in the very beginning of the Advanced tab:
function getLocations(){
    var geocoder = new google.maps.Geocoder();

    //since requests are async we'll need to use JQuerry's Deferred Object
    var promises = data.items.map(function(item, i){
        var result = $.Deferred();

        //time out slows down the process, but it allows each query to execute successfully
        //you might not need a timeout if you have premium account or use different API
        setTimeout(function(){

        var address = item.Address;
        geocoder.geocode( { 'address': address}, function(results, status) {
            if (status === 'OK') {
            var latitude = results[0].geometry.location.lat();
            var longitude = results[0].geometry.location.lng();
            item.latitude = latitude;
            item.longitude = longitude;

            result.resolve();
            }
            else{
            console.log("Error: " + status);
            result.reject();
            }

        });
        }, 1000 * i);
        return result.promise();
    });

    //when all locations get lat and lng, return resolved Promise
    return $.when.apply($, promises).then(function() {
        console.log('Resolved!');
    });
}
Next, we replace handlers.requestSuccess with the code to load Google Maps Geocoder script with your own API Key and then run getLocations() script:
handlers.requestSuccess = function(data, logger) {
    //first check if the script has loaded or not
    if(window.google && window.google.maps && window.google.maps.Geocoder){
        return getLocations();
    }

    //if not, load it first
    var dfd = $.Deferred();
    window.googleGeolocationScriptLoaded = function() {
        getLocations().then(function(){ dfd.resolve(); });
    }

    $.getScript("https://maps.googleapis.com/maps/api/js" +
                "?key=YOUR_API_KEY&callback=googleGeolocationScriptLoaded");

    return dfd.promise();
}
Click Process and wait for the data to process, it might take some time with all the delay. Next, in Dashboard section we go to Chart tab:

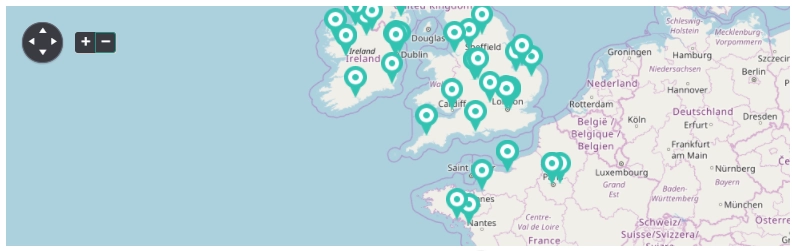
After selecting Map with markers chart type and configuring all fields, we press Preview and get the following chart:
Map Bubbles Chart
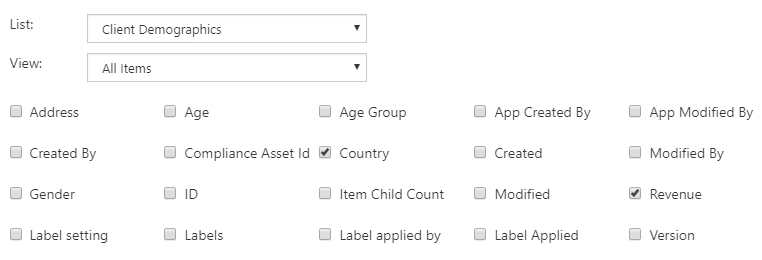
Next, we’ll get Map with bubbles chart to show how much revenue comes from each country. In our Data Source configuration, we select Country and Revenue while expanding the number of Rows, of course:
We’ll add the loadCountries() function before everything else in the Data Source – Advanced tab. This function will be used to initialize geocoder and send requests to Google Maps Geocoding API. There is still a quota, and even though amount of requests will be less this time, we still need to add delay, unless your personal quota allows to avoid it. First, we get all unique countries from our list. This will help us with the requests, so we don’t need to execute a request for each item, but can instead get results for every unique country in our list. Then, we go through data.items again and add latitude and longitude to each, based on the country and the location of the country returned from our requests. We add the following code in the very beginning of the Advanced tab:
function loadCountries(){
    //get all unique countries from the list
    var countries = [];
    data.items.forEach(function(item){
        if(countries.indexOf(item.Country) < 0){
            countries.push(item.Country);
        }
    });

    //get location for each country
    var geocoder = new google.maps.Geocoder();
    var countryLocations = {};
    var promises = countries.map(function(country, i){
        var result = $.Deferred();

        //time out slows down the process, but it allows each query to execute successfully
        //you might not need a timeout if you have premium account or use a different API
        setTimeout(function(){
        var address = country;
        geocoder.geocode( { 'address': address}, function(results, status) {
            if (status === 'OK') {
            countryLocations[country] = {
                lat: results[0].geometry.location.lat(),
                lng: results[0].geometry.location.lng()
            }
            result.resolve();
            }
            else{
            console.log("Error: " + status);
            result.reject();
            }
        });
        }, 1000 * i);

        return result.promise();
    });

    //when all countries get location, give lat and lng to items
    return $.when.apply($, promises).then(function() {
        console.log("RESOLVED!");
        data.items.forEach(function(item){
        item.latitude = countryLocations[item.Country].lat;
        item.longitude = countryLocations[item.Country].lng;
        });
    })
}
Next, we replace handlers.requestSuccess with the code to load Google Maps Geocoder script with your own API Key and then run loadCountries() script:
handlers.requestSuccess = function(data, logger) {
    //first check if the script has loaded or not
    if(window.google && window.google.maps && window.google.maps.Geocoder){
        return loadCountries();
    }

    //if not, load it first
    var dfd = $.Deferred();
    window.googleGeolocationScriptLoaded = function() {
        loadCountries().then(function(){ dfd.resolve(); });
    }

    $.getScript("https://maps.googleapis.com/maps/api/js" +
                "?key=YOUR_API_KEY&callback=googleGeolocationScriptLoaded");

    return dfd.promise();
}
Click Process and wait for the data to process, it might take some time with all the delay. After the data has been processed we go to Aggregation section and configure aggregation by Country:

We needed to process data first to be able to select latitude and longitude here. But now we need to click Process again after configuring the Aggregation. Next, in Dashboard - Chart tab, select Map with bubbles Chart Type and select fields we've added through Aggregation:

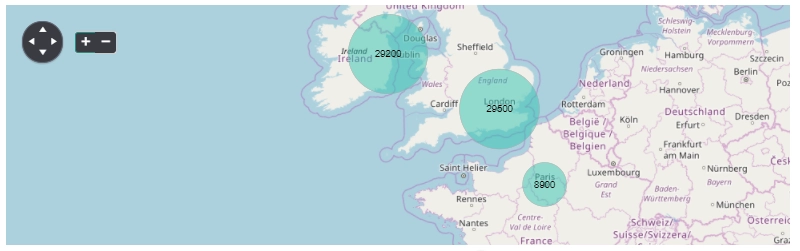
Click Preview and here's the result:
Hope you enjoyed another one of our tutorials and now we'll be able to use external APIs with your charts. Check out more map charts here - Bubbles on a map, Customize and rotate labels, or even a Floor Plan for SharePoint.