
Live Voting Chart
Dashboard
Data
Configuration
Revenue per Country
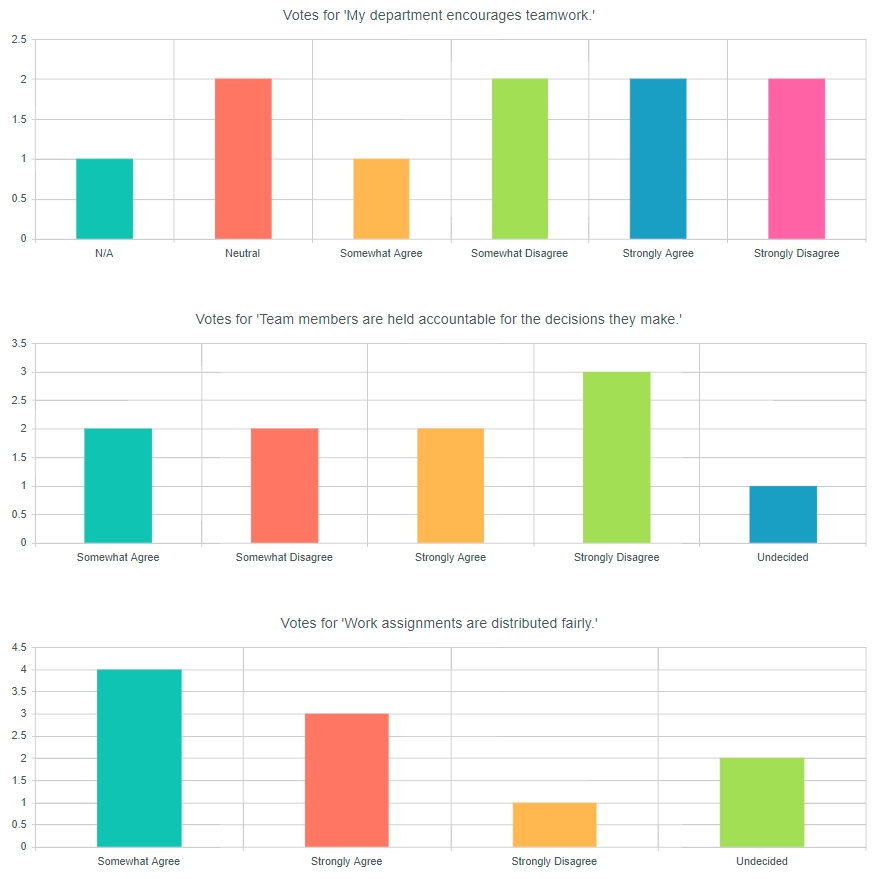
This chart displays total votes for a questionnaire in live mode.
Data Source
SharePoint List
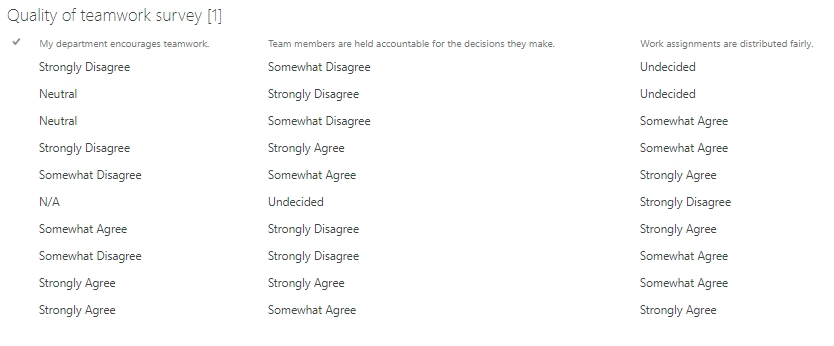
List: Quality of teamwork survey
Fields: ID and one of the following: My department encourages teamwork, Team members are held accountable for the decisions they make, Work assignments are distributed fairly.Aggregation:
Group by: one of the following: My department encourages teamwork, Team members are held accountable for the decisions they make, Work assignments are distributed fairly.Aggregations: none.
Dashboard
Chart
Type: Column
Display each group as separate series: yes
Category: one of the following: My department encourages teamwork, Team members are held accountable for the decisions they make, Work assignments are distributed fairly
Value: ID
Aggregate over category: yes
Unit: fit
Step: 1
Function: count
Refresh periodically: yes
Period is seconds: 5.If you want to change the rate at which your chart is being refreshed, you should edit the ‘Period in seconds’ setting.
Style
Display Legend: no.