Display dashboard on SharePoint public site in Microsoft 365
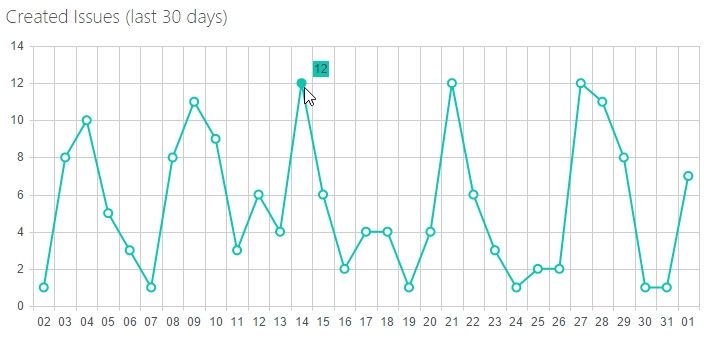
In this article I will describe how to publish a chart on a public site in Office 365 based on data coming from any site. First, I should say that currently it is impossible to retrieve data from lists via CSOM or REST API by anonymous users especially from private site collections. So we need to implement some kind of hybrid solution e.g. obtaining data under authenticated user and publishing it for anonymous access on a public site.

The following PowerShell script gathers data from a list on a private site and saves it as a text file in JSON format to a library on a public site:
Add-Type -Path "c:/Program Files/Common Files/microsoft shared/Web Server Extensions/15/ISAPI/Microsoft.SharePoint.Client.dll"
Add-Type -Path "c:/Program Files/Common Files/microsoft shared/Web Server Extensions/15/ISAPI/Microsoft.SharePoint.Client.Runtime.dll"

$username = "username"
$password = "password"
$sourceUrl = "private site URL"
$targetUrl = "public site URL"

$securePassword = ConvertTo-SecureString $Password -AsPlainText -Force
$sourceCtx = New-Object Microsoft.SharePoint.Client.ClientContext($sourceUrl)
$targetCtx = New-Object Microsoft.SharePoint.Client.ClientContext($targetUrl)

$credentials = New-Object Microsoft.SharePoint.Client.SharePointOnlineCredentials($username, $securePassword)
$sourceCtx.Credentials = $credentials
$targetCtx.Credentials = $credentials

# Gettings data from the source list (Issues)
$sourceList = $sourceCtx.Web.Lists.GetByTitle('Issues');
$camlQuery = New-Object Microsoft.SharePoint.Client.CamlQuery
$camlQuery.ViewXml = '<View>
                        <Query>
                            <OrderBy>
                                <FieldRef Name="Created" />
                            </OrderBy>
                            <Where>
                                <Geq>
                                    <FieldRef Name="Created" />
                                    <Value Type="DateTime">
                                        <Today OffsetDays="-30" />
                                    </Value>
                                </Geq>
                            </Where>
                        </Query>
                        <ViewFields>
                            <FieldRef Name="ID" />
                            <FieldRef Name="Created" />
                        </ViewFields>
                    </View>'

$items = $sourceList.GetItems($camlQuery)
$sourceCtx.Load($items)
$sourceCtx.ExecuteQuery();

$itemsArray = @();
foreach ($item in $items){
    $itemsArray += $item.FieldValues;
}

# Saving data to the target site
$content = ConvertTo-Json $itemsArray
$fileCreationInfo = New-Object Microsoft.SharePoint.Client.FileCreationInformation;
$fileCreationInfo.Overwrite = $true;
$fileCreationInfo.Content = [System.Text.Encoding]::UTF8.GetBytes($content);
$fileCreationInfo.Url = "/DashboardDesignerAppLib/charts/issues.data";

$folder = $targetCtx.Web.GetFolderByServerRelativeUrl("/DashboardDesignerAppLib/charts");
$file = $folder.Files.Add($fileCreationInfo);
$targetCtx.Load($file);
$targetCtx.ExecuteQuery();
As you can see I have included Microsoft.SharePoint.Client.dll and Microsoft.SharePoint.Client.Runtime.dll at the beginning of my code. You can install them with SharePoint Online Client Components SDK.
The code above retrieves Issues created over the last 30 days via CAML query and saves them as JSON-string into /DashboardDesignerAppLib/charts folder on a public site. We can schedule this script and run it as frequently as data changes or users need to see the latest updates. Now, go back to our public site. I will use Charts 1.4 to build a chart based on the data in the text file we have prepared at the previous step.
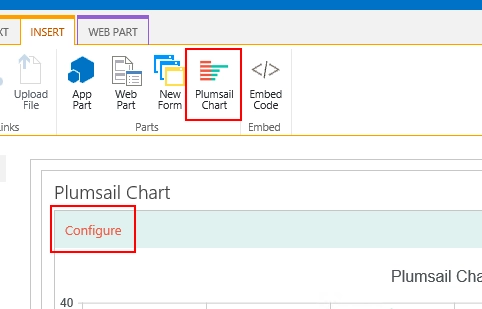
After installing the Charts from SharePoint Store and activating ribbon buttons you will find Plumsail Chart button on the Insert tab of the ribbon when you switch a page into edit mode. Click it to add a new chart under the cursor and navigate to the designer by clicking Configure within the chart:

Leave SharePoint site field on the Data source tab empty because we are not going to retrieve data from a list or library by requesting it with CAML-query. As I said, the part of CSOM and REST API in charge of CAML-queries is not available for anonymous users. So navigate to Advanced tab and use the following code to populate initial data from our text file:
handlers.init = function (data, logger) {
    var result = $.Deferred();

    $.ajax({
        url: '/DashboardDesignerAppLib/charts/issues.data',
        type: 'GET'
    })
    .done(function (content) {
        try {
            var items = JSON.parse(content, JSON.dateParser);
            data.items = items;
        } catch (e) { }
    })
    .always(function () {
        result.resolve();
    });

    return result.promise();
}
As you can see I pass JSON.dateParser handler into JSON.parse function. This is because my data contains date fields which have to be parsed into JavaScript Date objects. By default they are represented as strings in the parsed object. Here is the definition of JSON.dateParser function that has to be appended on the Advanced tab as well:
if (window.JSON && !window.JSON.dateParser) {
    var reISO = /^(d{4})-(d{2})-(d{2})T(d{2}):(d{2}):(d{2}(?:.d*))(?:Z|(+|-)([d|:]*))?$/;
    var reMsAjax = /^/Date((d|-|.*))[/|\]$/;

    JSON.dateParser = function (key, value) {
        if (typeof value === 'string') {
            var a = reISO.exec(value);
            if (a)
                return new Date(value);
            a = reMsAjax.exec(value);
            if (a) {
                var b = a[1].split(/[-+,.]/);
                return new Date(b[0] ? +b[0] : 0 - +b[1]);
            }
        }
        return value;
    };
}
Ok, now we can group and calculate aggregations with Charts as if we retrieved it directly from a SharePoint list. If you need to design a dashboard that covers multiple lists from different sites, for instance, aggregates all tasks or issues through the site collection and visualizes their statuses on a public site, you can prepare a corresponding PowerShell script and upload ready-to-use data to a public site as we have done here.