Customize and rotate labels and tooltips in SharePoint charts
How to customize and rotate labels and tooltips in SharePoint charts
This article describes functionality of templates in Charts. Labels and tooltips in our charts have a property titled ‘template’ that allows you to customize their content.
Template is a string that can contain text mixed with variables of the current item. It can be item or group depending on whether or not your data is grouped.
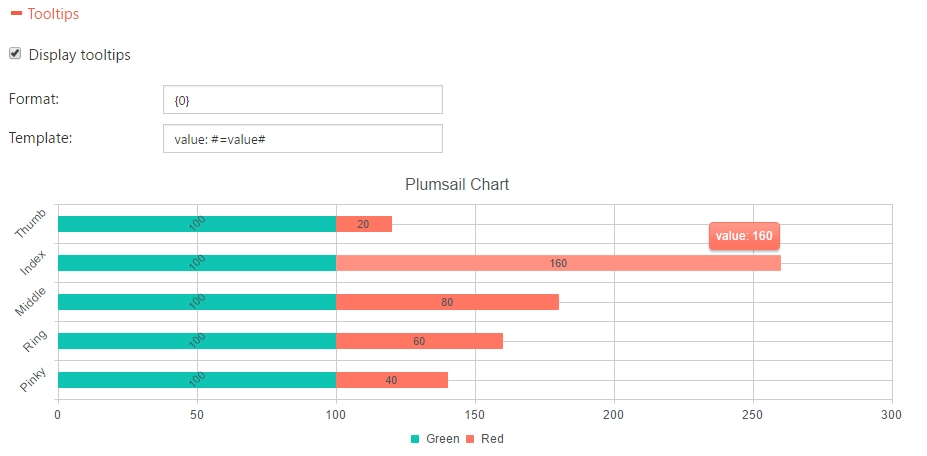
Here is an example of the simplest template:

String consists of the text ‘value:’ and the local variable ‘value’ that contains default value of the tooltip. Variables or JavaScript functions you use in templates must be wrapped in ‘#= .. #’.
Templates work identically for labels and tooltips. You can use any global or context variables:
dataItem – an object from data.items (or data.groups from your data source);
value – a field or a constant representing the current item’s value.
Example 1
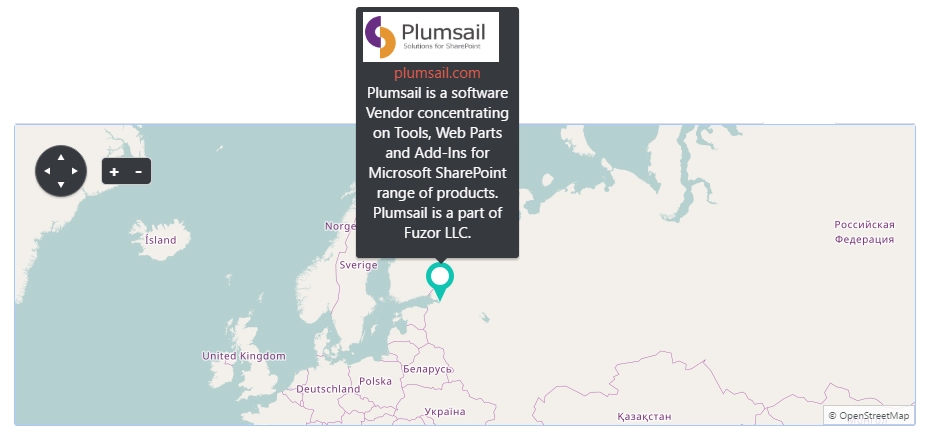
Templates may also contain HTML-content. For instance, here we use Map with markers and customized template for tooltips:

The source list we used here contains columns for logo, description, and website.
Here is the template (Dashboard -> Style -> Markers -> Tooltip template):
<div style="width:150px"><a href="#=marker.dataItem.link#"><img height="50px" src="#=marker.dataItem.logo#">#=marker.dataItem.link#</a><p style="font-size:0.8em;"> #=marker.dataItem.text# </p></div>
Example 2
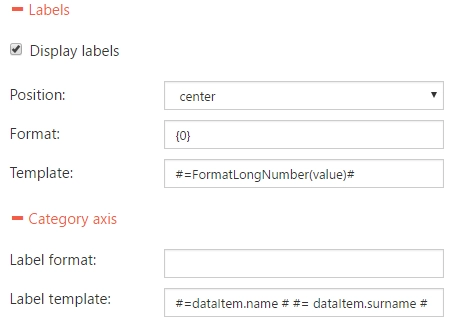
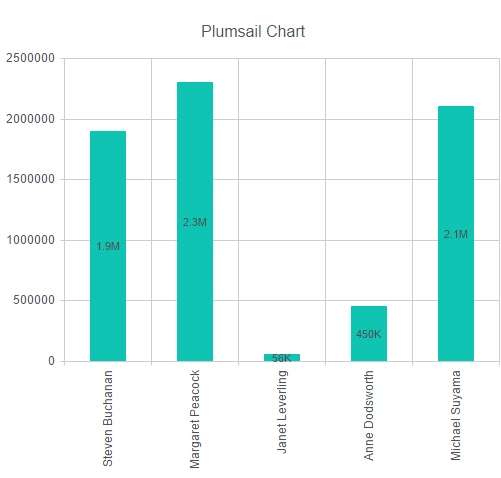
This example illustrates a use of JavaScript-functions in templates. In preRender handler we define a function of the global variable‘window’ that shorten long numbers. Next, we use this function in the labels template (Dashboard -> Style -> Labels -> Template).
Also we join two columns from the original rows in the Category axis’ template (Dashboard -> Style -> Category axis -> Label template):

Code from Dashboard -> Advanced:
var handlers = {};
handlers.preRender = function (config, logger) {
logger.debug('Configuration: ', config);
window.FormatLongNumber = function (value) {
if (value == 0) {
return 0;
}
else {
// hundreds
if (value <= 999) {
return value;
}
// thousands
else if (value >= 1000 && value <= 999999) {
return (value / 1000) + 'K';
}
// millions
else if (value >= 1000000 && value <= 999999999) {
return (value / 1000000) + 'M';
}
// billions
else if (value >= 1000000000 && value <= 999999999999) {
return (value / 1000000000) + 'B';
}
else
return value;
}
}
return true;
}The result:

How to rotate labels
If we make width of the previous chart smaller, the labels in the category axis will cover each other. To avoid this behavior, we can rotate them.
Here is a line of code we need to add to the preRender handler to rotate category axis’ labels 90 degrees:
config.categoryAxis.labels.rotation = -90;
The result:

You can also rotate labels in columns. The code below rotates labels for the first series only:
var handlers = {};
handlers.preRender = function (config, logger) {
    config.categoryAxis.labels.rotation = -45;

    var index = 0; //index of a series
    config.series[index].labels = config.series[index].labels || {};
    config.series[index].labels.rotation = -45;

    return true;
}
The result:

And if you want to rotate labels of all series, use the code below:
var handlers = {};
handlers.preRender = function (config, logger) {
    config.categoryAxis.labels.rotation = -45;

    config.seriesDefaults.labels = config.seriesDefaults.labels || {};
    config.seriesDefaults.labels.rotation = -45;

    return true;
}
The result:
