Configure aggregation and sorting
Aggregation and Sorting
You might’ve noticed that in some situations when you try to sort items for your graph, the sorting gets broken when you perform aggregation on it. That’s a common pitfall and this article will help you to avoid this problem.
First, let’s see an example of what I am talking about. You have a List of items and it contains several columns, in my example it is Category, Customer and Amount. Category and Customer are Lookup fields.
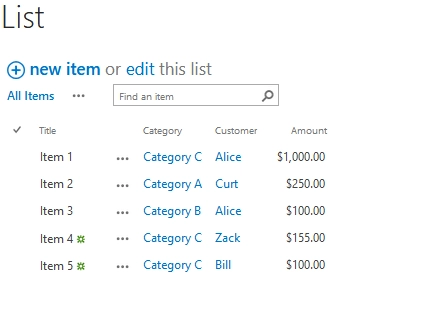
Now I want to build a graph for this list, where I can see amounts for every category, but I also want to see each customer on the graph. I create a graph, open its configuration and set it up like this:

I also edit CAML query to sort results by Category:
<View>
    <Query>
        <OrderBy>
        <FieldRef Name="Category" />
        </OrderBy>
    </Query>
    <ViewFields>
        <FieldRef Name="LinkTitle" />
        <FieldRef Name="Category" />
        <FieldRef Name="Customer" />
        <FieldRef Name="Amount" />
    </ViewFields>
    <RowLimit Paged="TRUE">300</RowLimit>
</View>
Next, I want to Group it by Customer, so I can see every customer on my graph:
I go to Charts -> Chart and set Display each group as a separate series.
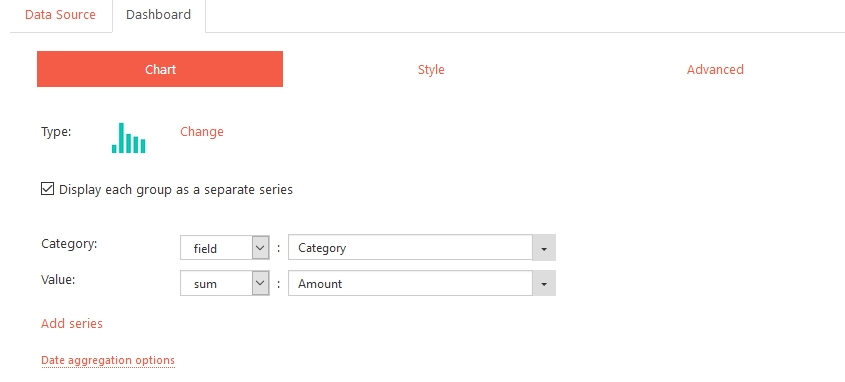
It should work, right? Let’s take a look:
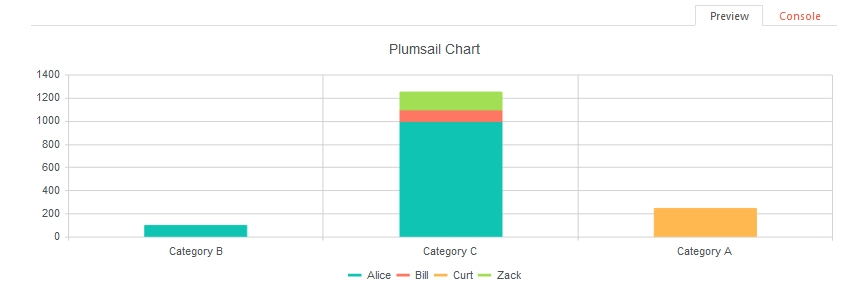
It doesn’t work… At least not as I intended. It displays all the correct info, but the order is all wrong. It should be Category A, then B, then C. How to fix it? Unfortunately, we’ll need to use JavaScript.
The problem is in the fact that Aggregation breaks the sorting. It happens so, because sorting gets applied to each group one by one, and if the first group doesn’t have all the Categories, then the sorting order will be wrong by the time it gets to the second group. In order to ensure that sorting happens properly, we’ll need to insert fake items for each Category in the first group.
Let’s go to Data Source -> Advanced, and write our code there. First, let’s get a list of all available Categories:
var categories = [];

handlers.requestSuccess = function(data, logger) {
    for(var i = 0; i < data.items.length; i++){
        categories.push(data.items[i].Category);
    }

    var unique = categories.filter(function(itm, i, categories) {
        return i == categories.indexOf(itm);
    });

    categories = unique;

    return true;
}
Next, we clone the first item of the first group, give it Amount equal to zero so it doesn’t affect our graph in any way and insert it into first group with for loop, each time with different Category, so the first group already has access to all Categories and can sort them all correctly:
handlers.aggregationSuccess = function(data, logger) {
    //Make all categories available in the first group
    for(var i = 0; i < categories.length; i++){
        //Clone the first item in the first group
        var clone = $.extend({}, data.groups[0].items[0]);
        //Set Amount to zero, so the added items do not appear on the chart
        clone.Amount = 0;
        clone.Category = categories[i];
        data.groups[0].items.push(clone);
    }

    //Sort categories based on all items in first group
    //This will now sort all the Categories, since we added them inside
    data.groups[0].items.sort(function(a, b) {
        return a.Category > b.Category;
    });

    return true;
}
With this out of the way, all our items should be properly sorted. Let’s take a look!
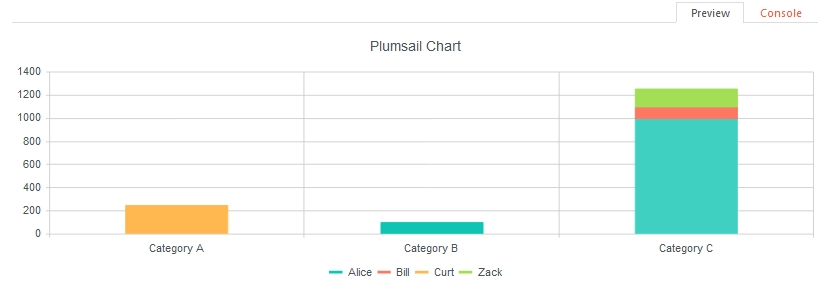
As you can see, everything is sorted correctly and works as expected. In this case I used categories, but you can replace them with anything you want and it should work just like this.
Sorting in special order
So, you want to sort your list by some certain special order, not alphabetically or by number, for example by Months, where Months are plain text, not date. That’s also possible using code. If you don’t use aggregation, it is a fairly simple process, you just need to add this code to your Dashboard ->Advanced tab:
var handlers = {};
handlers.preRender = function(config, logger) {
    logger.debug('Configuration: ', config);

    var ordering = ['January', 'February', 'March',
    'April', 'May', 'June', 'July', 'August', 'September',
    'October', 'November', 'December'];

    Array.prototype.sort.call(config.series[i].data, function(a, b) {
        return ordering.indexOf(a.Month) - ordering.indexOf(b.Month);
    });

    return true;
}
But that would only work if you don’t use Aggregation. In case you do, we’ll need to repeat process from the previous section. Here we have a similar list, where instead of categories' Lookup, I use months' Lookup:
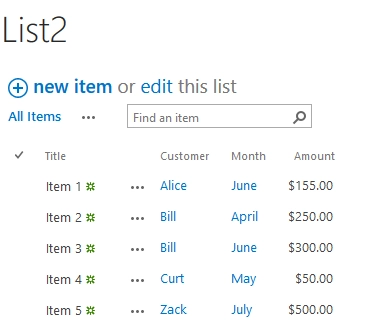
This is configuration of my Data Source:

CAML:
<View>
    <Query>
        <OrderBy>
        <FieldRef Name="Month" />
        </OrderBy>
    </Query>
    <ViewFields>
        <FieldRef Name="LinkTitle" />
        <FieldRef Name="Customer" />
        <FieldRef Name="Month" />
        <FieldRef Name="Amount" />
    </ViewFields>
    <RowLimit Paged="TRUE">300</RowLimit>
</View>
And I also use aggregation by Customer:
In order to properly sort this graph, I need to add code to Data Source -> Advanced tab. First, I need to get all unique months in my List:
var months = [];

handlers.requestSuccess = function(data, logger){
    for(var i = 0; i < data.items.length; i++){
        months.push(data.items[i].Month);
    }

    var unique = months.filter(function(itm, i, months){
        return i == months.indexOf(itm);
    });

    months = unique;

    return true;
}
Then, I need to sort them by adding another array with the order of Months inside the code, also in Data Source -> Advanced tab, but this time inside aggregationSuccess function:
handlers.aggregationSuccess = function(data, logger) {
    //Add an array that will include all the possible Months
    var ordering = ['January', 'February', 'March',
    'April', 'May', 'June', 'July', 'August', 'September',
    'October', 'November', 'December'];

    //Make all months available in the first group
    for(var i = 0; i < months.length; i++){
        //Clone the first item in the first group
        var clone = $.extend({}, data.groups[0].items[0]);
        //Set Amount to zero, so the added items do not appear on the chart
        clone.Amount = 0;
        clone.Month = months[i];
        data.groups[0].items.push(clone);
    }

    //Sort categories based on all items in first group
    //This will now sort all the Months, since we added them inside
    data.groups[0].items.sort(function(a, b) {
        if ( ordering.indexOf(a.Month) > ordering.indexOf(b.Month) )
        return 1;
        if ( ordering.indexOf(a.Month) < ordering.indexOf(b.Month) )
        return -1;

        return 0;
    });

    return true;
}
Finally, I can configure and build my chart:
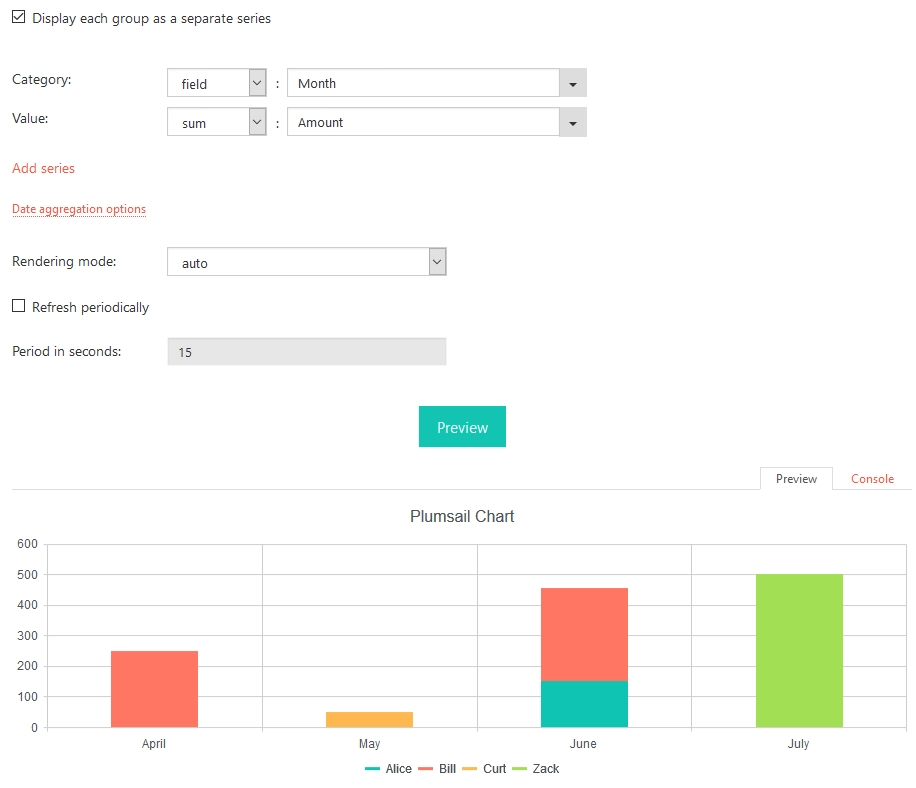
As you can see, the Months are properly sorted and I can see each client on my chart. Just what I wanted! There is another way to achieve similar result and I will demonstrate it to you in the next section.
Sorting with an additional column
Instead of adding an array to the code, we can add a column to the Lookup list which will give us the order. For example, I can add Order column to the Months List:
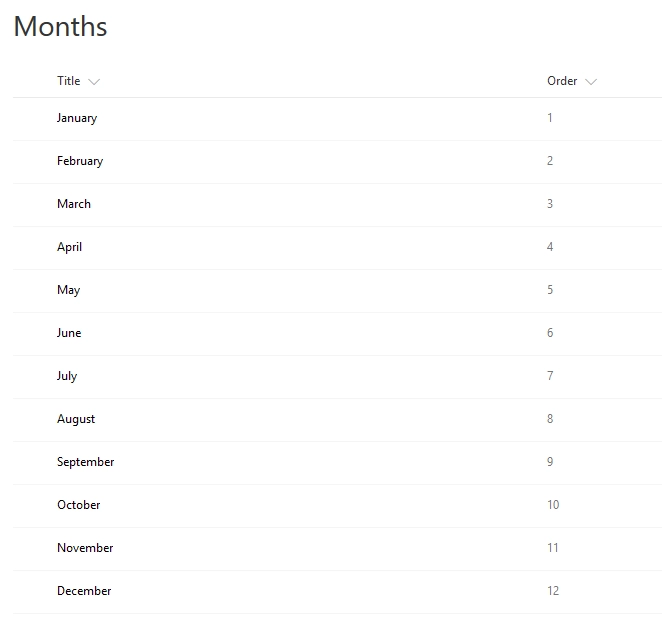
Now that the column is added, I need to enable additional field for my Lookup column. For that, I go to original Sorting List and in List settings select my Lookup column to edit, then add Order as an additional column:
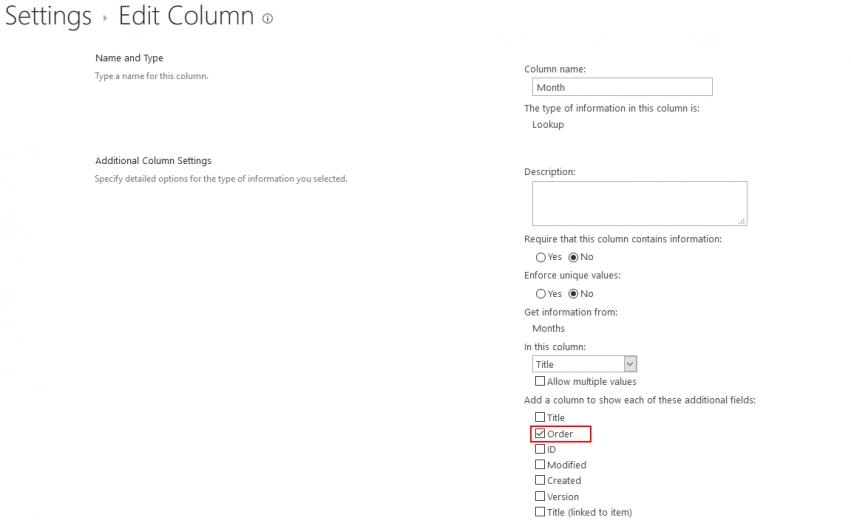
It will look like this by default, but you can change the order of columns or hide this column if you modify View for the List:
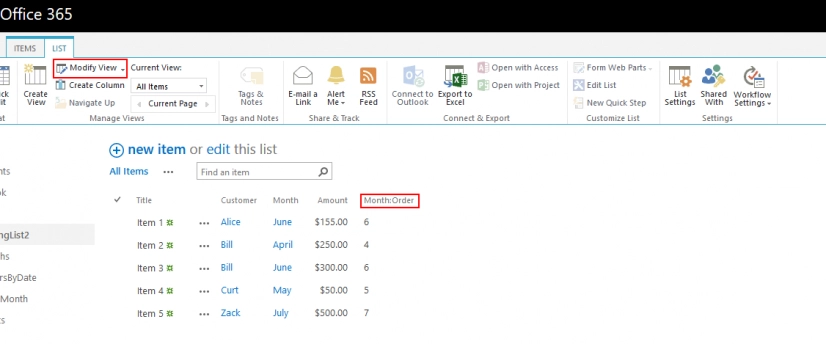
Now I go to my Chart and set it up like this:
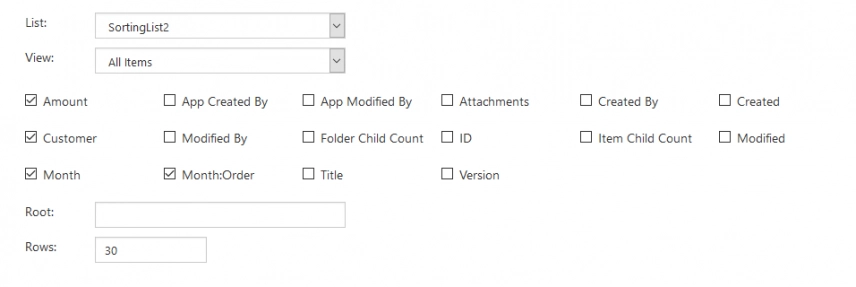
CAML:
<View>
    <Query>
        <OrderBy>
        <FieldRef Name="Month" />
        </OrderBy>
    </Query>
    <ViewFields>
        <FieldRef Name="LinkTitle" />
        <FieldRef Name="Customer" />
        <FieldRef Name="Month" />
        <FieldRef Name="Amount" />
        <FieldRef Name="Month_x003a_Order" />
    </ViewFields>
    <RowLimit Paged="TRUE">300</RowLimit>
</View>
I also set up Aggregation by Customer, once again:
Finally, it’s time to add code needed to the Data Source -> Advanced tab. First I get all unique Months and Month orders in the list:
var months = [];
var monthOrder = [];

handlers.requestSuccess = function(data, logger) {
    for(var i = 0; i < data.items.length; i++){
        months.push(data.items[i].Month);
        monthOrder.push(data.items[i].Month_x003a_Order);
    }

    var uniqueMonths = months.filter(function(itm, i, months) {
        return i == months.indexOf(itm);
    });

    var uniqueOrder = monthOrder.filter(function(itm, i, monthOrder) {
        return i == monthOrder.indexOf(itm);
    });

    months = uniqueMonths;
    monthOrder = uniqueOrder;

    return true;
}
I then sort items by their Month Order field:
handlers.aggregationSuccess = function(data, logger) {
    //Make all months available in the first group
    for(var i = 0; i < months.length; i++){
        //Clone the first item in the first group
        var clone = $.extend({}, data.groups[0].items[0]);
        //Set Amount to zero, so the added items do not appear on the chart
        clone.Amount = 0;
        clone.Month = months[i];
        clone.Month_x003a_Order = monthOrder[i];
        data.groups[0].items.push(clone);
    }

    //Sort categories based on all items in first group
    //This will now sort all the Months, since we added them inside
    data.groups[0].items.sort(function(a, b) {
        if ( a.Month_x003a_Order > b.Month_x003a_Order )
        return 1;
        if ( a.Month_x003a_Order < b.Month_x003a_Order )
        return -1;

        return 0;
    });

    return true;
}
Finally, I configure and build the chart:
-41ce278def097c754afeb88dc1358e2c.webp)
As you can see we get the same result. This method might be better in some cases, where you have a lot of items and you don’t want to manually assign them order in the array. Instead, you can use any column from the original List, even ID, if it’s in correct order.