Documents
Jul 22
How to use SharePoint images in Power Automate
Learn to retrieve SharePoint images and use them with Plumsail Documents to generate branded Word and PDF reports automatically.

Imagine you give lots of data to an artificial intelligence (AI) tool. It analyzes the data, and you get a PowerPoint presentation with detailed charts and graphs, showing all the conclusions you need. Pretty cool, right? This is exactly what's happening now: AI is increasingly used to solve business tasks.
For example, AI is used in due diligence for mergers and acquisitions (M&A). Marc Vogelsang, a senior manager at Ernst & Young Switzerland, points out that AI tools are getting better at gathering public data, analyzing it, identifying risks, and making conclusions. These tools are expected to change how things are done. He provides a great example in his article "How AI will impact due diligence in M&A transactions":

The annual report mentions that the target has sold a real estate property in FY 2022. AI can pick this up autonomously and check whether all the documentation that is common in connection with such a sale is available. In seconds, the software could flag a missing notarial deed or a tax declaration where the purchase price does not match the amounts in the financial statements.
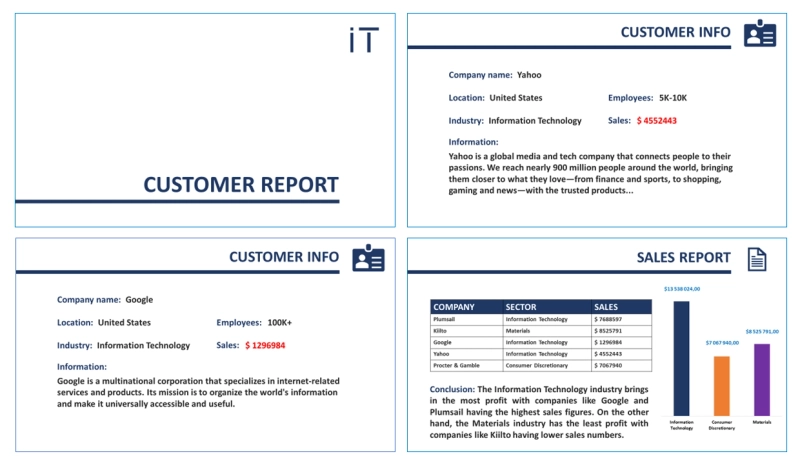
In this post, we'll look at a simpler example to help you start using AI for your reports. We'll create a presentation about customers and sales, including steps like:
We'll connect all the tools in Power Automate, but you can use any other integration platform.
Further in the article:
Before setting up workflows, let's examine the data we will be working with. The screenshot below displays a data table containing information about clients in Dynamics 365; this table is built based on data stored in Dataverse. Therefore, when creating an action in a Power Automate flow, we will directly access the Dataverse platform.
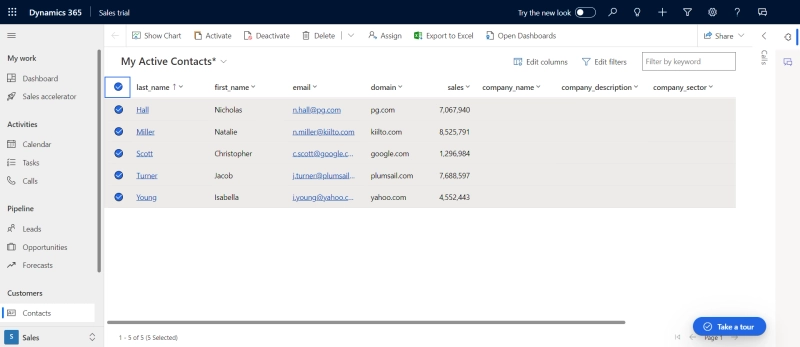
This table comprises the following columns:
Additionally, there are empty columns that we intend to enhance with Clearbit data:
Our database table has already been pre-configured to align with the specific data formats defined within each column. Make sure you go over your database tables closely, because if the data types don't match up, it can mess up when you're trying to load or get data out.
Next, we will proceed with the setup and configuration of the PowerPoint report generation process within Plumsail Documents. This entails the completion of the following steps:
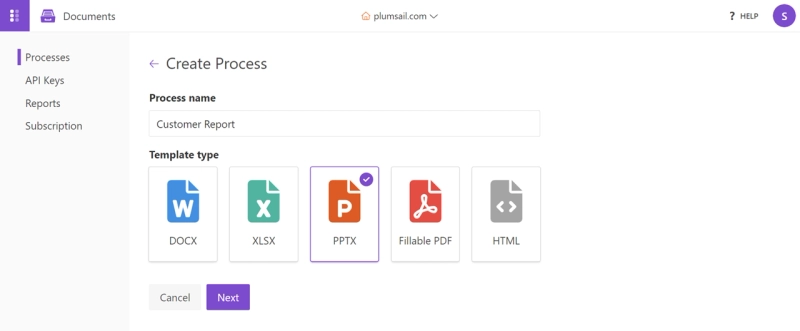
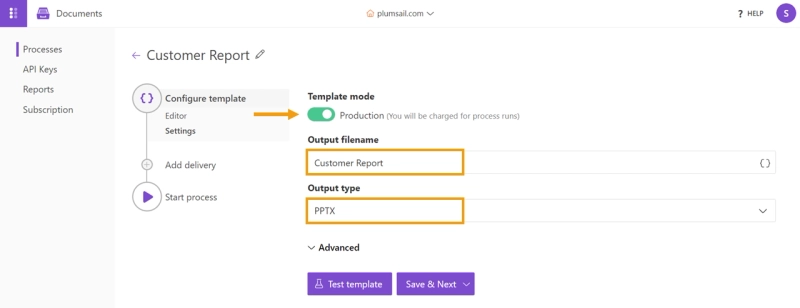
In this step, we will need to customize our template. You will find more detailed information on this action in the section Prepare and test a template of the Plumsail Documents Documentation.
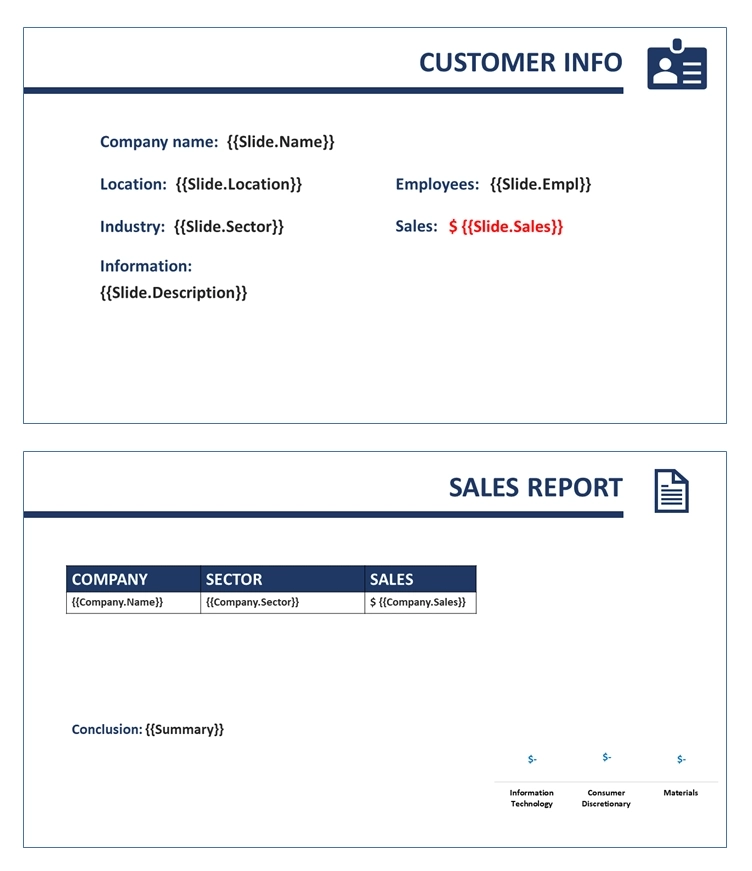
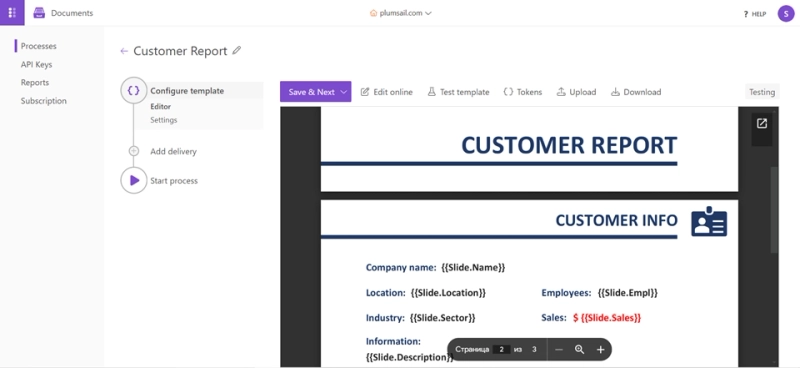
Editor:
Our ready-made PowerPoint template includes tokens. Tokens in a template serve as special placeholders or markers designed for dynamically inserting data into a document or presentation. When a program processes the template, it replaces these tokens with real data from a data source, such as a database, table, or any other provided information source.
Template tokens can be divided into three categories:
Read more about PowerPoint template syntax in documentation.
Below is the JSON template.
{
  "Slide": [
    {
      "Name": "value1",
      "Sector": "value2",
      "Description": "value3",
      "Empl": "value4",
      "Location": "value5",
      "Sales": "value6"
    }
  ],
  "Company": [
    {
      "Name": "value1",
      "Sector": "value2",
      "Sales": "value3"
    }
  ],
  "chart": [
    {
      "it": "value1",
      "cd": "value2",
      "mat": "value3"
    }
  ],
  "Summary": "value1"
}
Configure outgoing file:
You can read about this action in the Plumsail Documents Documentation.
In this section, we must determine the method of delivering the document.
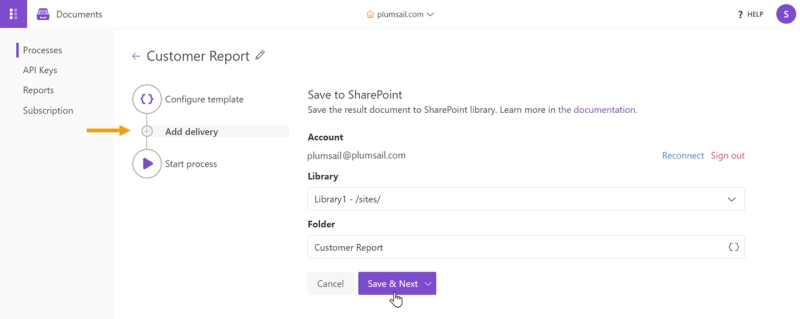
For a thorough exploration, turn to the Documentation in section Deliver generated documents.
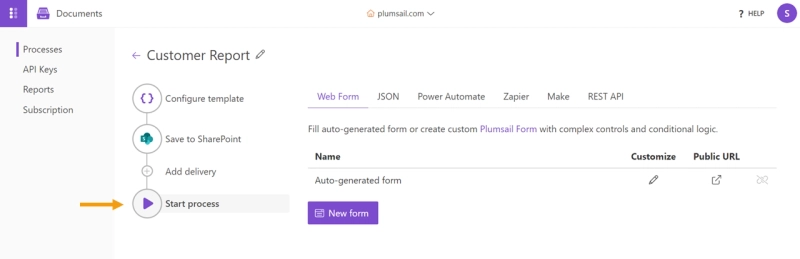
Setting up the PowerPoint report generation process is complete. let's move on to setting up our flow in Power Automate.
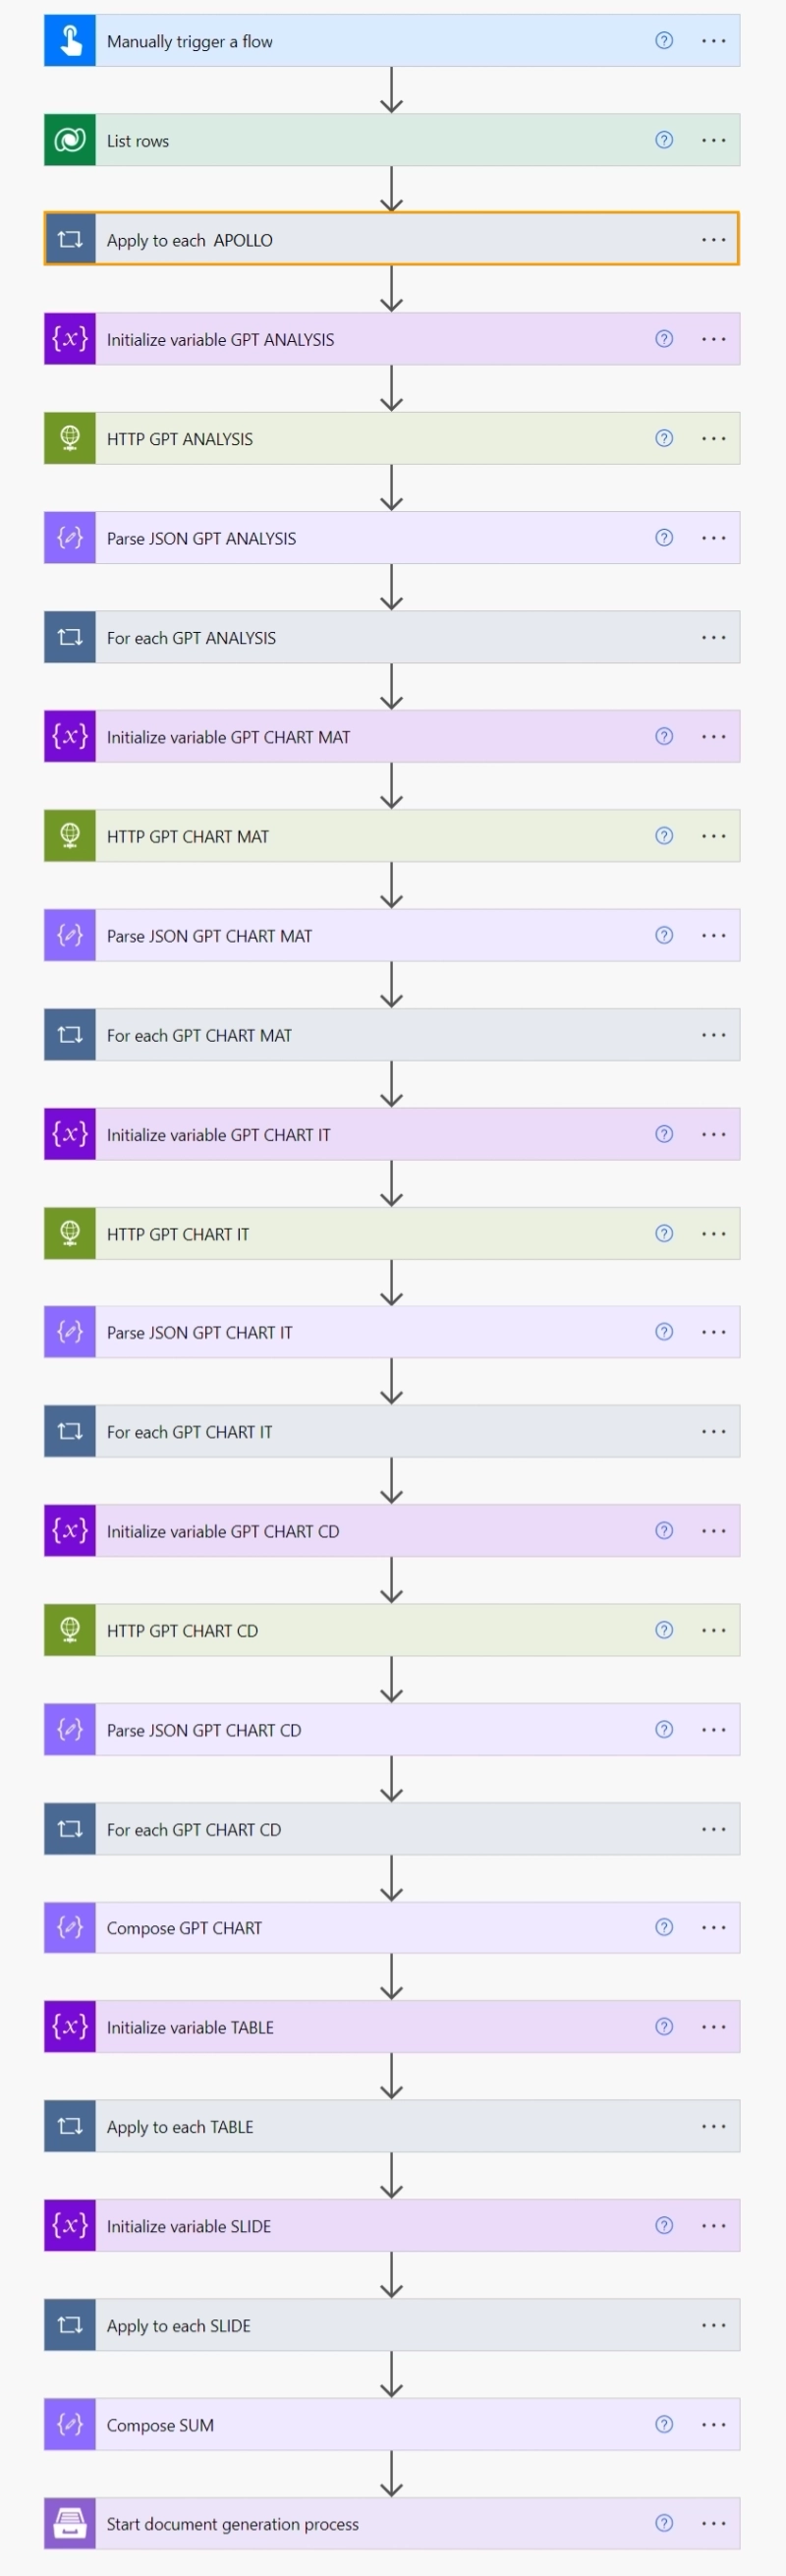
After our preparation is completed, we move on to the stage of creating a flow using Power Automate. We can conditionally divide our flow into 3 steps:
For the convenience of reviewing the entire flow, we switched to the old interface design, then all screenshots will be made using the new design.
In order to enrich the database with data, we need an account on the Clearbit platform. Clearbit is a data enrichment platform that provides detailed information about people and companies, often used for marketing, sales, and recruitment purposes. It offers a suite of APIs that enable businesses to improve their customer interactions by providing more context about their users.
NOTE: Currently, Clearbit has paused new registrations but remains accessible for existing users. If you don't have an account, it's recommended to proceed directly to the section Use Apollo or other ClearBit alternatives to enrich CRM data.
After logging into your Clearbit account, in the settings, you can find your individual API key. We need it to send HTTP requests from Power Automate.
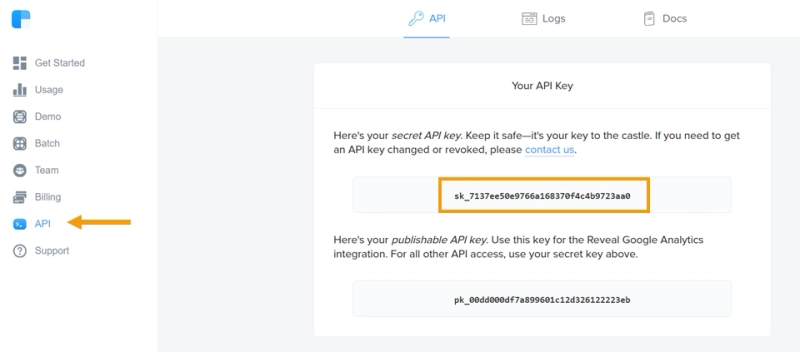
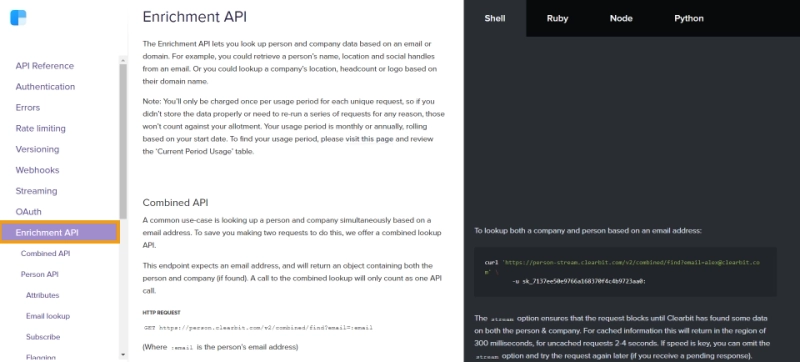
We also need the request URL, which we can find in the Clearbit Documentation. The documentation provides a list of requests that allow you to access different data. Some of them are only available with a paid subscription, but there are also free ones.
Now we can return to Power Automate and begin setting up the steps in the first stage:
Trigger Setup:
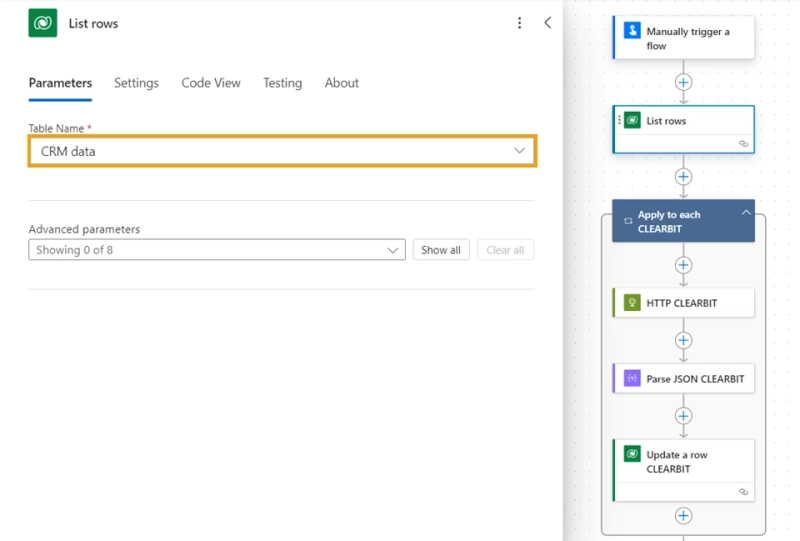
Get data from Dataverse to HTTP request:
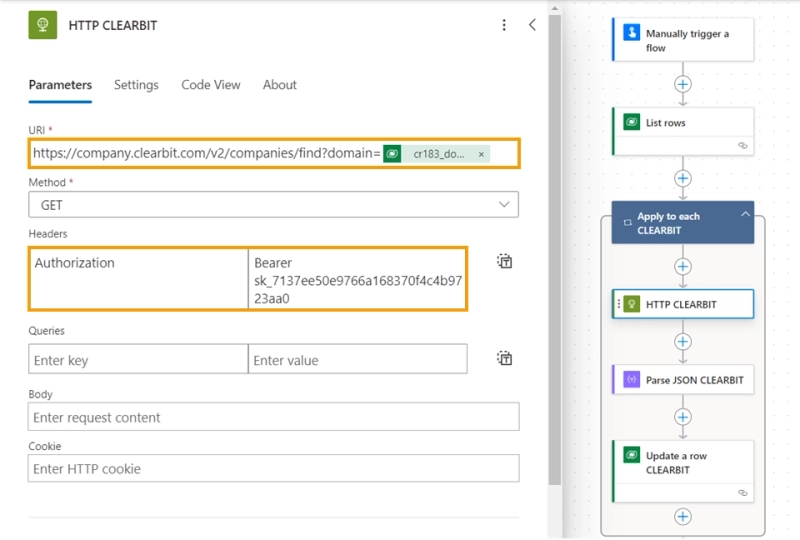
Get Data from Clearbit:
Using a domain name from the Dataverse table, we search for the company that owns it. Along with the company name, extracting additional information about it from Clearbit. We took the request URL from the Clearbit documentation, which contains a detailed description of it.
You can also find more information about authentication method in the Сlearbit Documentation.
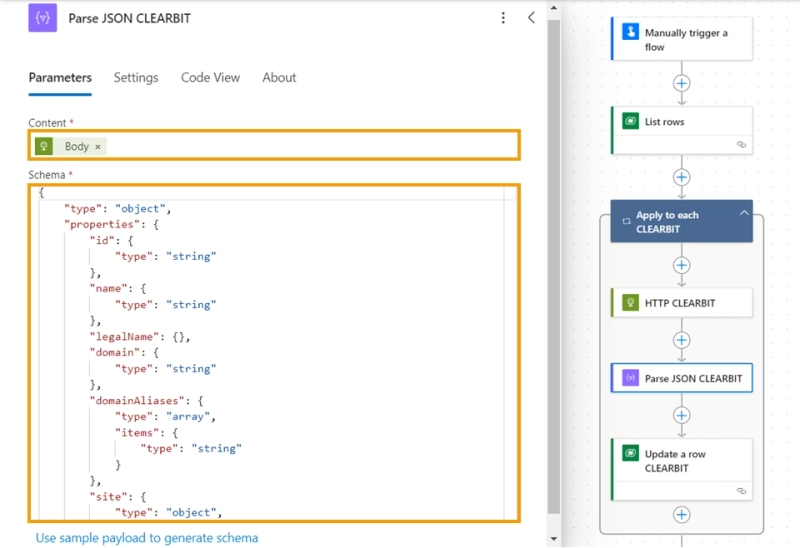
Parse Clearbit Data:
You can generate the scheme based on the examples given in the Clearbit Documentation in the request description.
Add Data to Dataverse:
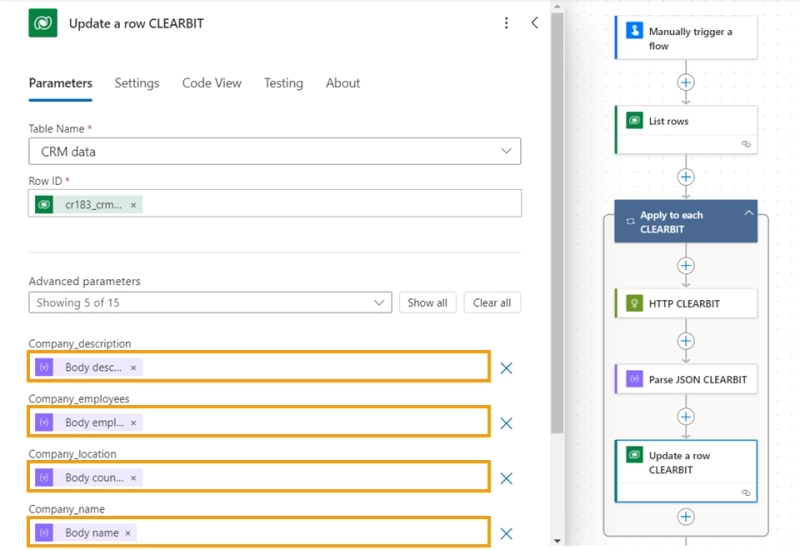
Setting up the table data enrichment process is complete. After launching the flow, our Dataverse table will be enriched with new data. At the same time, the data is updated in Dynamics 365
If you haven't registered for Clearbit due to the recent pause on new sign-ups, or if you're exploring other enrichment options, here are some reliable alternatives that integrate well with Power Automate via API:
Apollo offers comprehensive contact enrichment and lead generation capabilities, making it a powerful alternative to Clearbit. With its extensive database, Apollo enables you to search for companies by domain and retrieve valuable information on industry, size, location, and employee details. This flexibility makes it ideal for enhancing CRM data with insights into customer businesses.
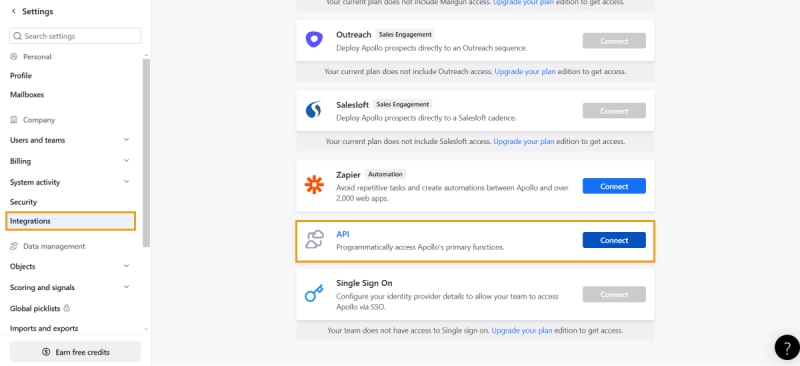
To start using Apollo, follow these steps to generate an API key:
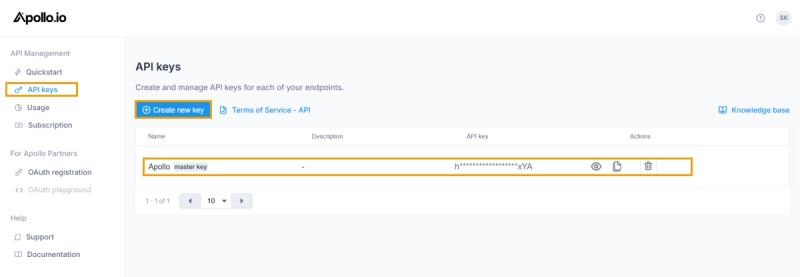
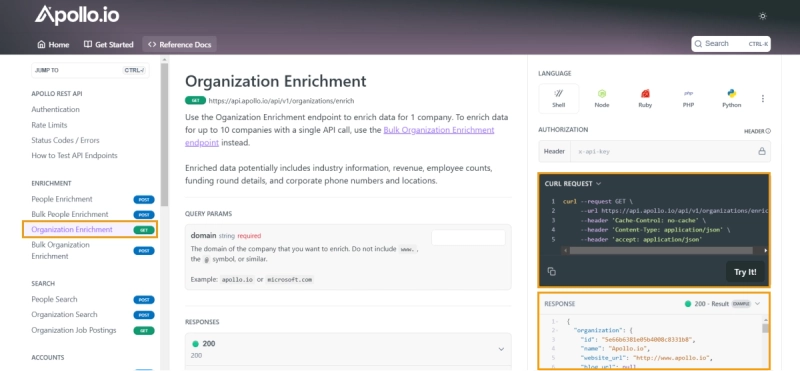
After creating the API key, proceed to Apollo API documentation to get the request URL and understand available parameters. For CRM enrichment using a domain, you can use the Organization Enrichment API endpoint. The endpoint offers detailed company information, such as name, industry, employee count, location, and sector, based on the provided domain and other.
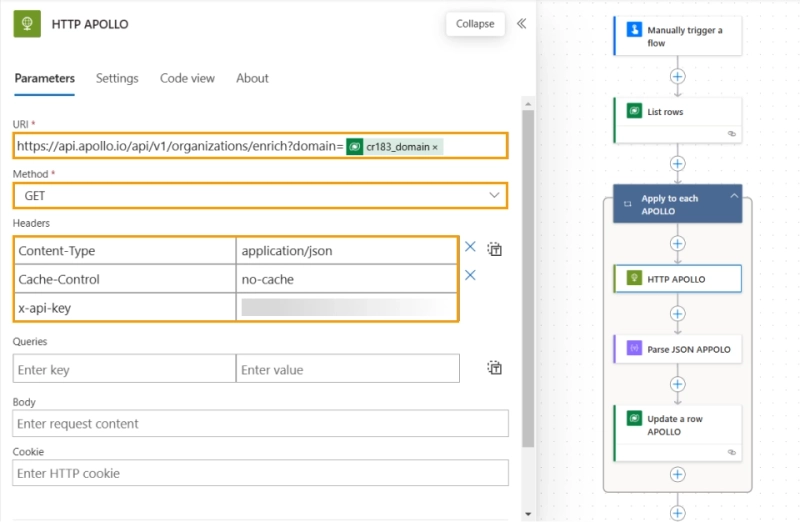
Get Data from Apollo
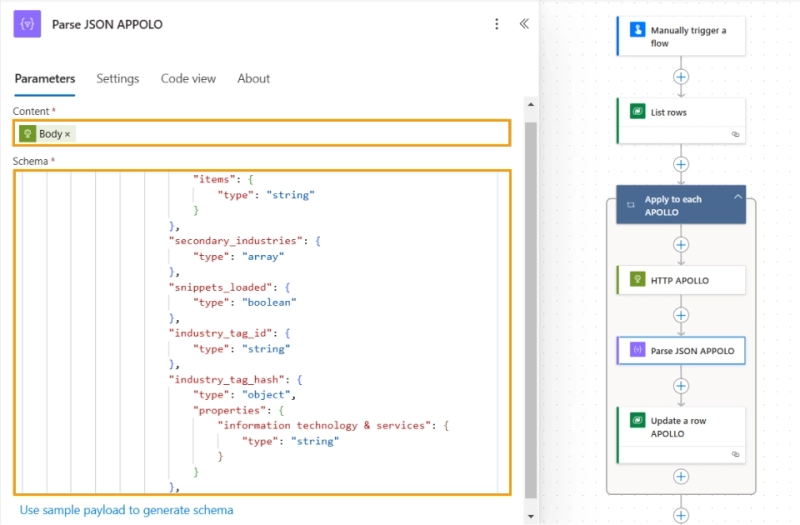
Parse Apollo Data
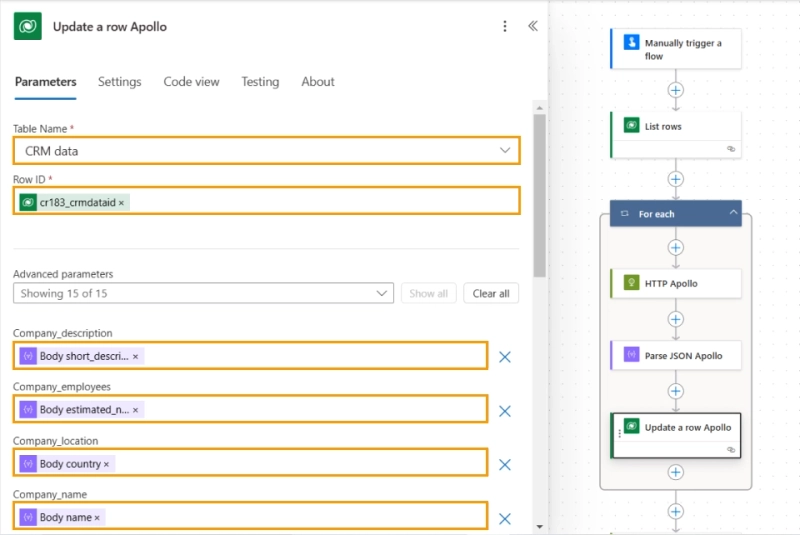
Add enriched data to Dataverse
@{item()?['crm_record_id']}
We've recreated an alternative part of the flow using Apollo instead of Clearbit. This modified flow section can be used in the same way to enrich CRM data, providing flexibility if Clearbit is unavailable or another service is preferred. Simply swap out the Clearbit steps in Power Automate with this Apollo setup to achieve similar data enrichment results. The rest of the Power Automate flow remains unchanged.
Once we have augmented our CRM database with data, we proceed to analyze it using ChatGPT. Data analysis will involve the use of HTTP requests, for which we require an API key and a request URL.
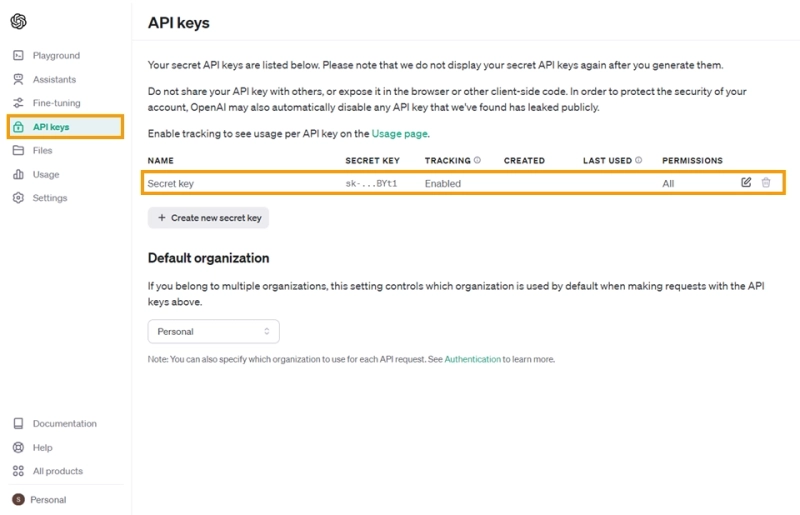
To do this, we switch to the ChatGPT platform. Log in to your account. Click on the lock icon on the left panel and find yourself in the section with our API keys.
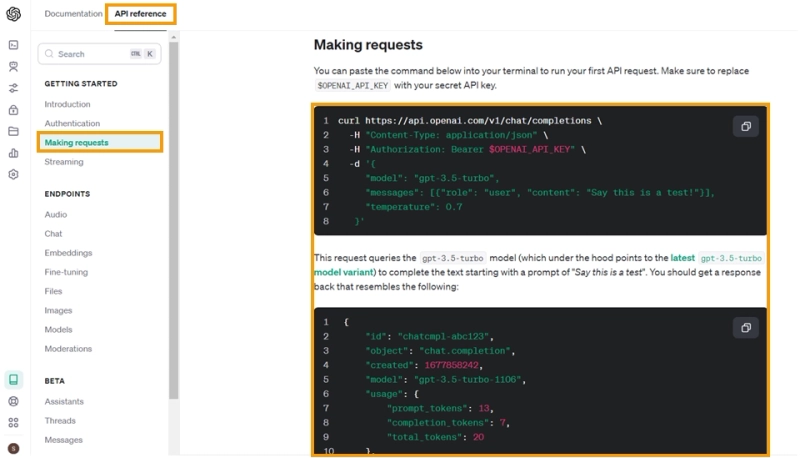
To get acquainted with the ChatGPT API requests in detail, you can return to the initial documentation page and click on the top tab API reference. In the Making requests you will find the requests. In addition, the documentation also has a section describing authentication methods when making a request. It's located right above Making requests.
NOTE: To send API requests, you must have funds on your balance. You can check your balance in the Usage section.
Now we can go back to our flow in Power Automate and add new steps to analyze the data. Let's start by adding an HTTP request:
Add an HTTP action to analyze the data from Dataverse
{
  "model": "gpt-3.5-turbo-0125",
  "messages": [
    {
      "role": "user",
      "content": "Analyze the data from @{body('List_rows')} and conclude company sales, write down the companies in which industries bring in the most profit and the companies in which industries have the least. Write industries and company names without additional characters. Present your answer in 2 sentences."
    }
  ],
  "temperature": 0.7
}
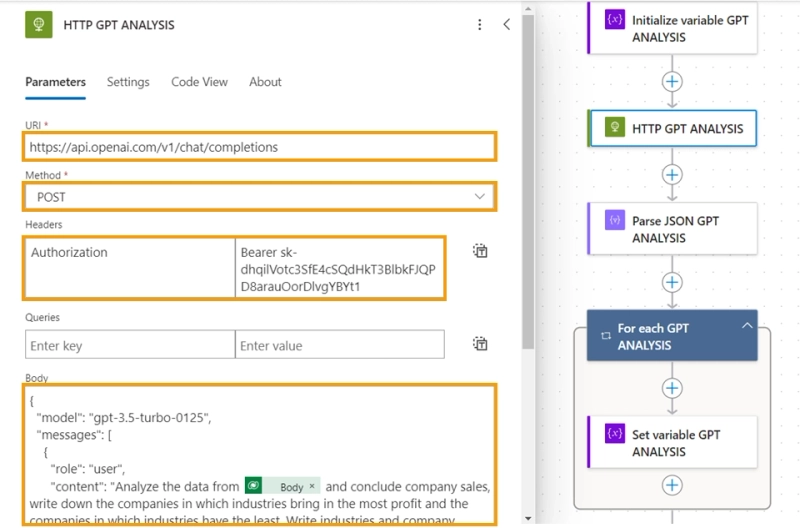
In the body of the request, we chose the gpt-3.5-turbo-0125 model because it allows us to increase the number of characters in the response. A list of all models and their limitations can be found in the ChatGPT Documentation.
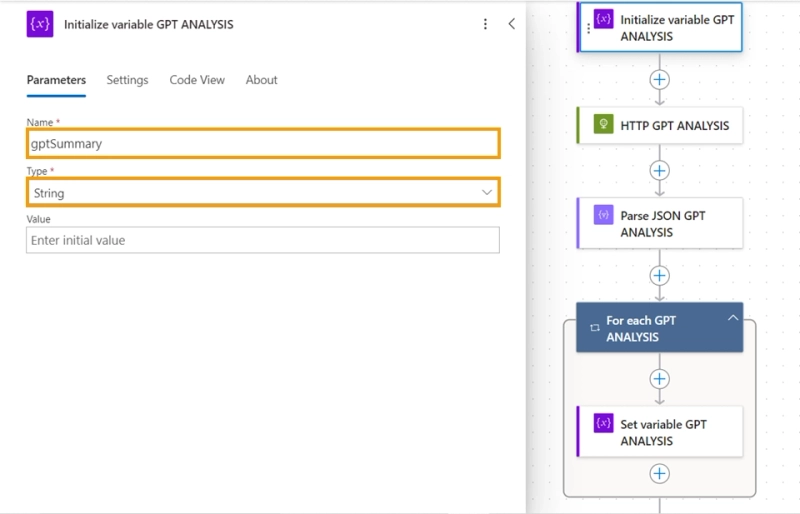
We also need to record the ChatGPT response into a variable in order to later merge it with our data array from the database. The variable will need to be created before the request and assigned a string type. Also, before setting the value of the variable, we will need to do Parse JSON.
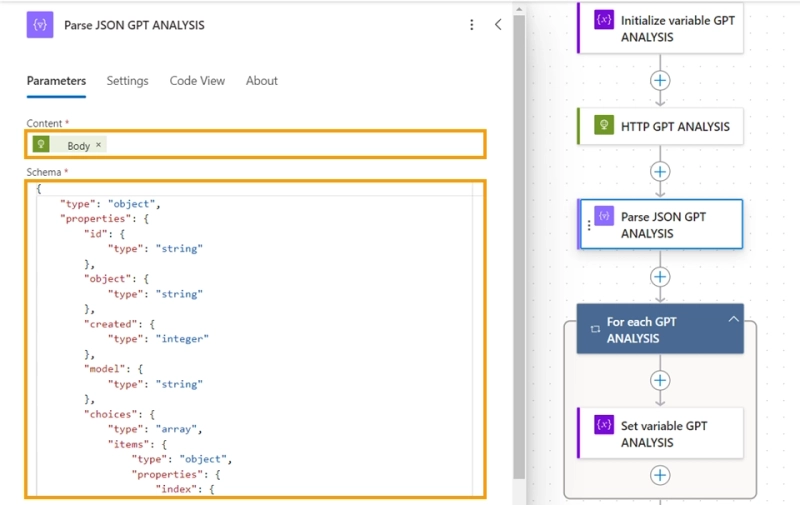
Parse ChatGPT Data:
Create a variable to store the response:
Assign a value to the variable:
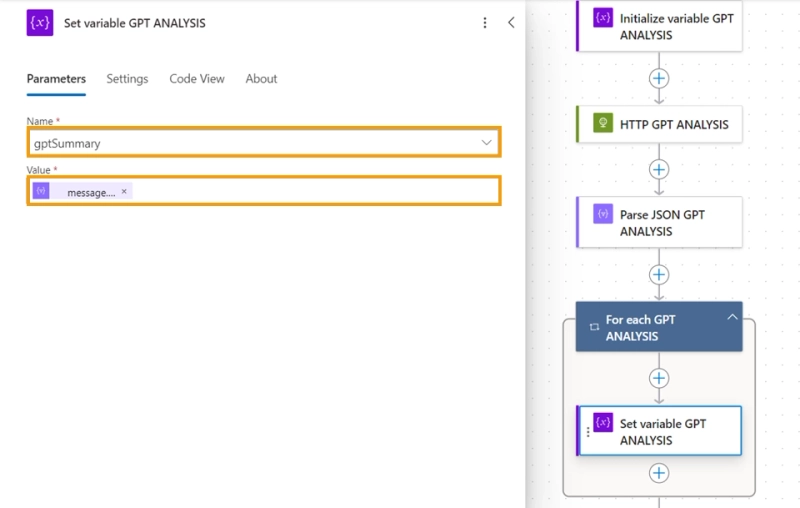
Now information with analysis of the enriched Dataverse table is stored in the gptSummary variable.
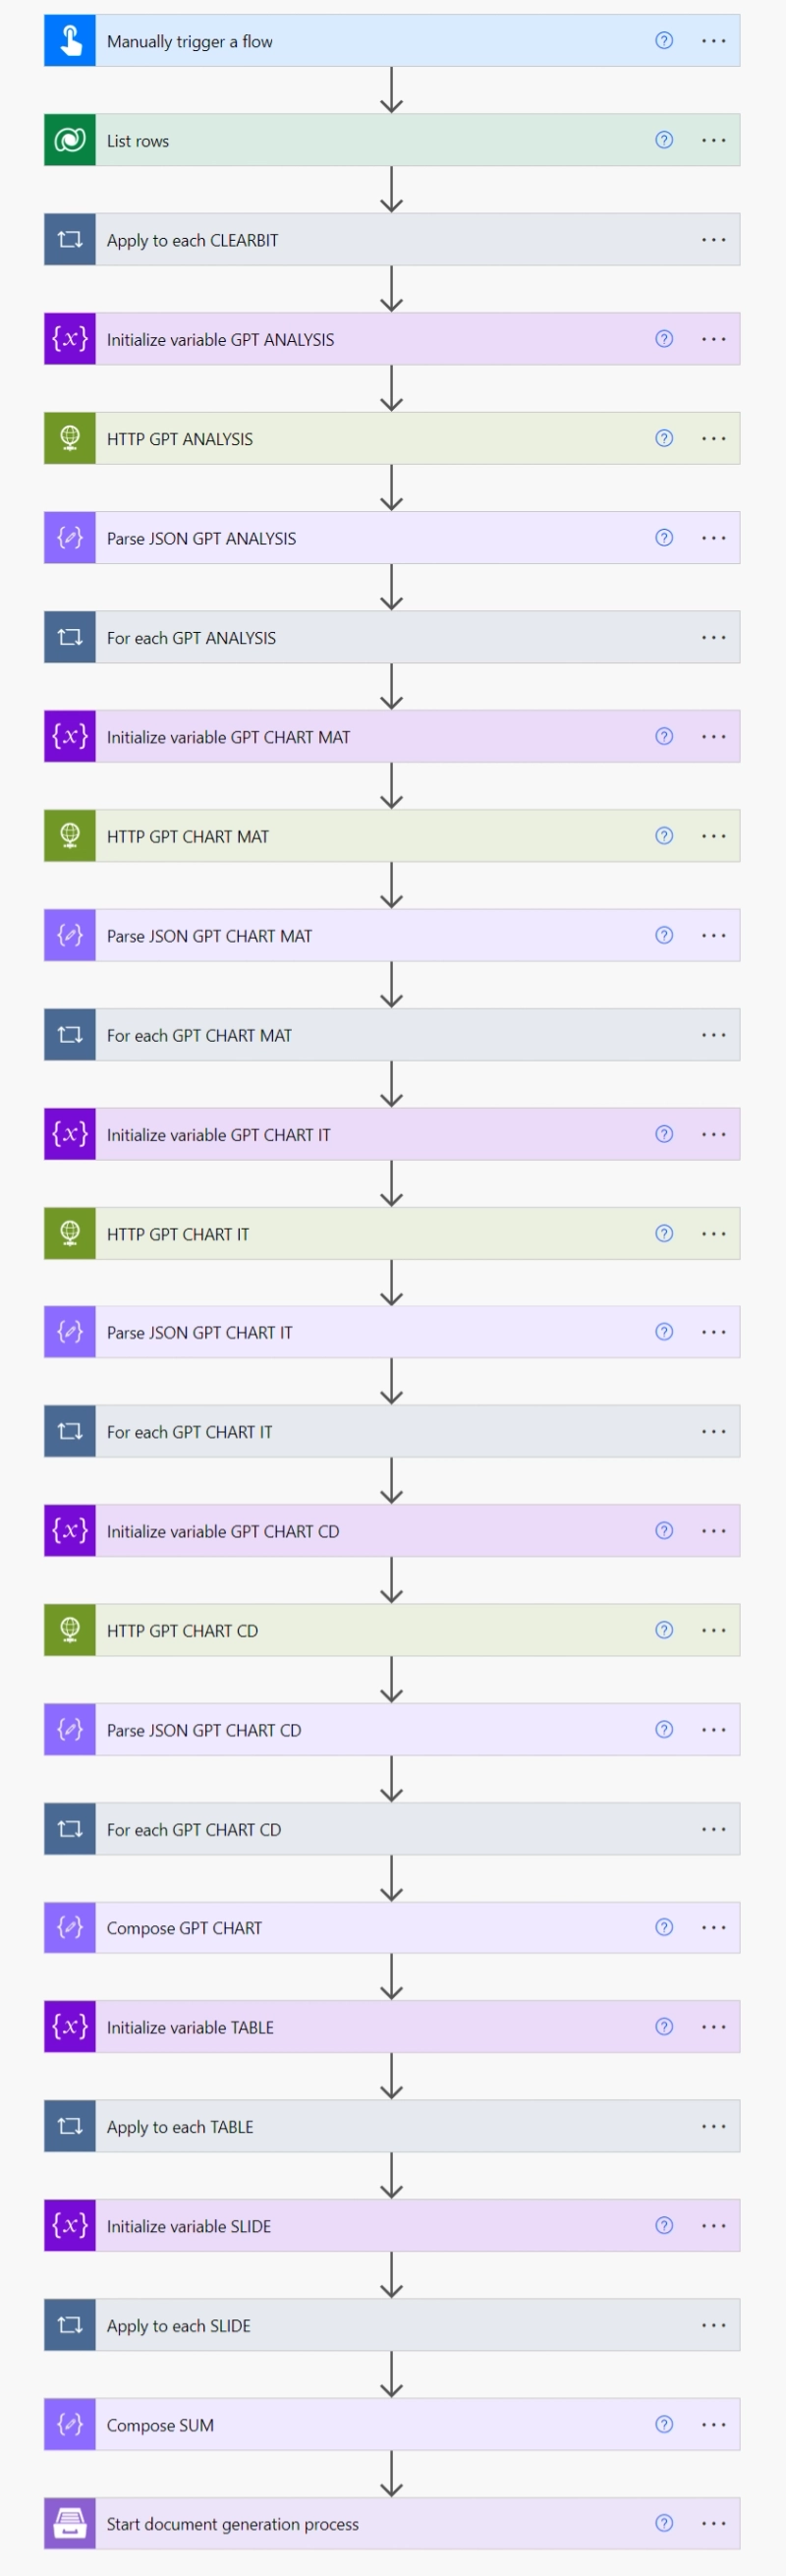
The next step is to do some math using ChatGPT. We will ask the artificial intelligence to sum up the sales of each industry separately, then we will form a data array from the values and pass it to our template along with the rest of the data.
Our diagram contains 3 columns and for each of them we will need to create an HTTP request. And write them into variables:
And then compose them.
Let's walk through the process of creating an industry variable using the gptMath variable as an example. To do this, we need to create an HTTP for the ChatGPT, similar to the previous request.
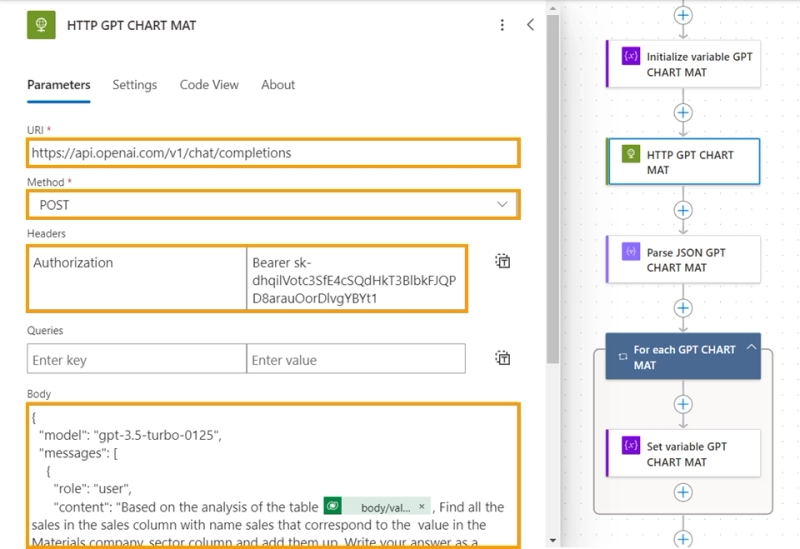
Add an HTTP action for mathematical calculations of variables for charts
{
  "model": "gpt-3.5-turbo-0125",
  "messages": [
    {
      "role": "user",
      "content": "Based on the analysis of the table @{outputs('List_rows')?['body/value']}, Find all the sales in the sales column with name sales that correspond to the value in the Materials company_sector column and add them up. Write your answer as a number without using letters or words in the format: number. "
    }
  ],
  "temperature": 0.7
}
Parse ChatGPT Data:
Create a variable to store the response:
Assign a value to the variable:
We do the same steps for the remaining two variables: "gptCd" and "gptIt". When all three variables are ready, you will need to connect them using the Compose action, according to the JSON schema for the generated document template.
Compose Data for chart
{
  "it": @{variables('gptIt')},
  "cd": @{variables('gptCd')},
  "mat": @{variables('gptMat')}
}
Setting up processing of mathematical actions using ChatGPT is complete. Now we can use the results to generate a presentation chart.
NOTE: When creating requests to artificial intelligence, try to formulate the exact question and indicate in what format you want the answer.
At the final stage, we will need to create all the data we are missing and populate it to our template using Plumsail Documents
According to our template JSON, we need to have 3 data arrays:
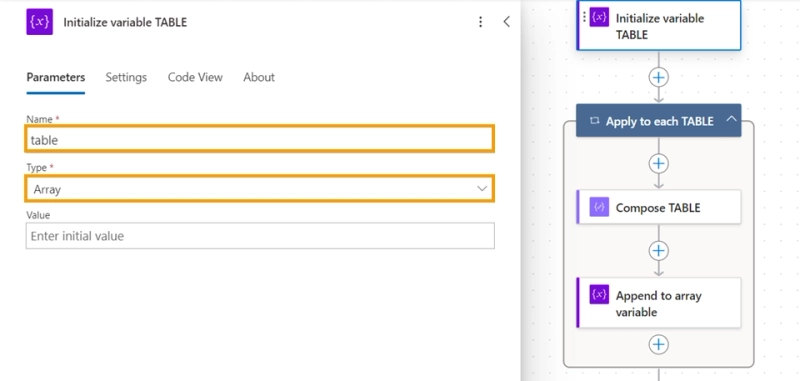
We have already prepared the data to create the chart in our previous step. Now we need to create variables for the table and slide arrays. Let's start by creating an array variable for the table:
Initialize variable for table
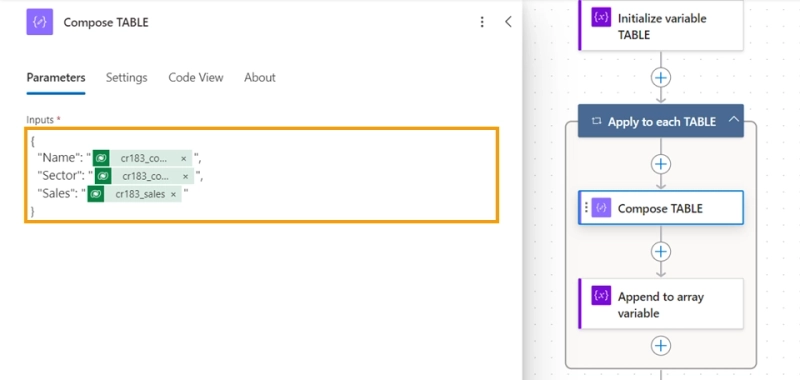
Compose Data for table
{
  "Name": "@{items('Apply_to_each_TABLE')?['cr183_company_name']}",
  "Sector": "@{items('Apply_to_each_TABLE')?['cr183_company_sector']}",
  "Sales": "@{items('Apply_to_each_TABLE')?['cr183_sales']}"
}
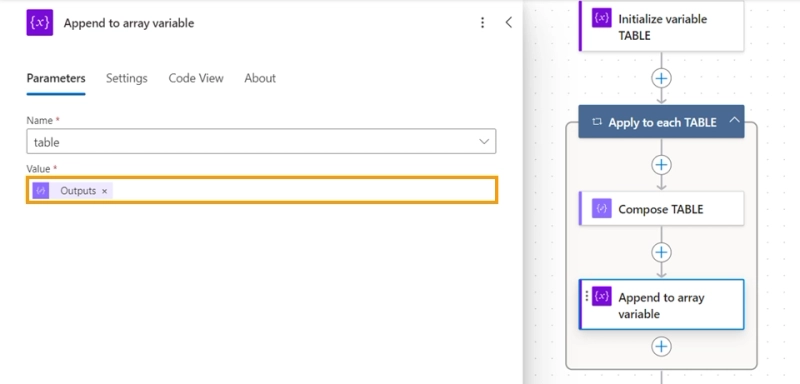
Assign a value to the variable:
We will need to go through the same steps to create a variable for the data array to generate company slides. The only difference will be the parameters of the Compose action. In the Inputs field we will indicate:
{
   "Name": "@{items('Apply_to_each_SLIDE')?['cr183_company_name']}",
   "Sector": "@{items('Apply_to_each_SLIDE')?['cr183_company_sector']}",
   "Description": "@{items('Apply_to_each_SLIDE')?['cr183_company_description']}",
   "Empl": "@{items('Apply_to_each_SLIDE')?['cr183_company_employees']}",
   "Location": "@{items('Apply_to_each_SLIDE')?['cr183_company_location']}",
   "Sales": "@{items('Apply_to_each_SLIDE')?['cr183_sales']}"
}
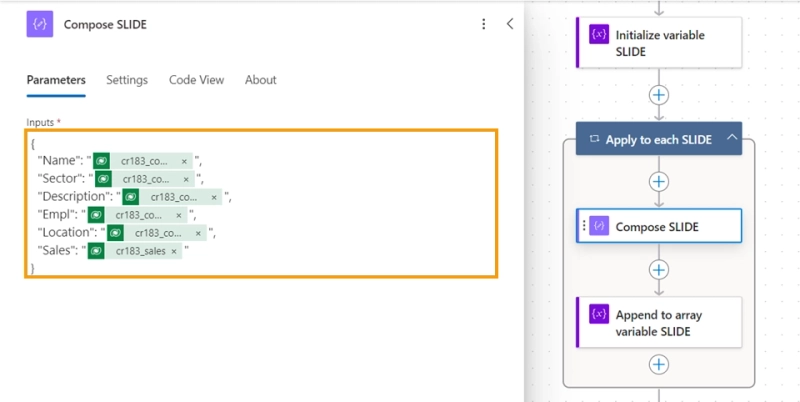
We will also indicate the format of the new variable as an array with name: "slide".
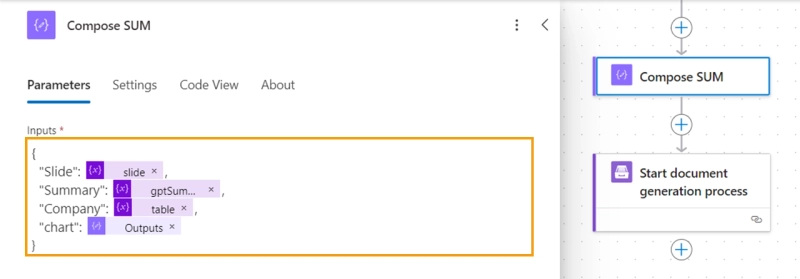
Next, we will populate the resulting data array to a PowerPoint template and generate our report using Plumsail Documents.
Compose of received data into an array
{
  "Slide": @{variables('slide')},
  "Summary": @{variables('gptSummary')},
  "Company": @{variables('table')},
  "chart": @{outputs('Compose_GPT_CHART')}
}
Transfer data to a template and generate a PowerPoint document using Plumsail Documents
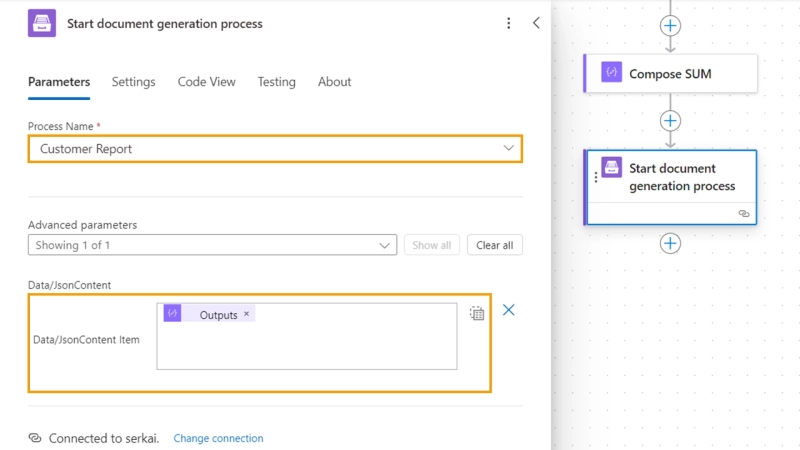
The settings for our flow are complete. Now, after launching the flow, a PowerPoint report will be generated using the summarized data from the enriched table and ChatGPT.
Now you've seen how to use Power Automate as a bridge to connect Clearbit or alternative solution like Apollo and ChatGPT, enabling you to dive deeper into customer behavior and fine-tune your business strategy. This guide has highlighted how, through Power Automate, you can orchestrate the flow of data between tools for more comprehensive analysis and reporting. By leveraging Plumsail Documents within this ecosystem, you're equipped to automatically generate detailed reports and dynamic PowerPoint presentations. Improving the quality of CRM data and expanding analytical capabilities with artificial intelligence plays a critical role in making well-informed decisions.
This method can be applied to various business operations, providing a way to automate and optimize processes effectively.
A close collaboration between AI software and experienced humans will be vital to offer top-notch M&A due diligence services in the future.
This collaboration proves beneficial not only for M&A due diligence but also across a wide range of business processes.
Register an account and get a 30-day free trial to explore endless possibilities.
If you have an issue setting up automation by yourself, you can always book a free Intro call with Plumsail and tell us your pain points and we will give our best to make it happen for you. Start automation now!
Learn to retrieve SharePoint images and use them with Plumsail Documents to generate branded Word and PDF reports automatically.
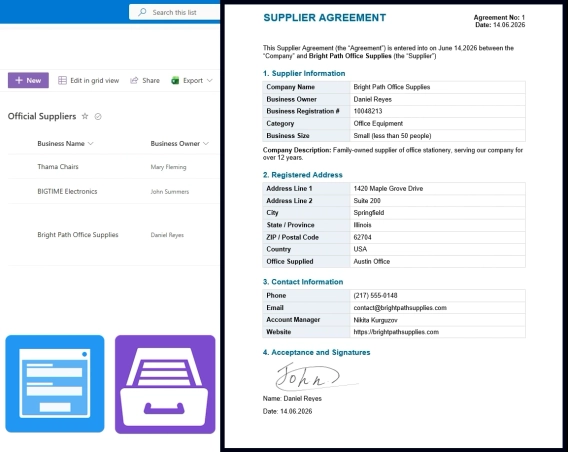
Build a supplier onboarding form that saves straight to SharePoint — no vendor login, attachments support, conditional field visibility, e-signatures, and automatic contract generation.
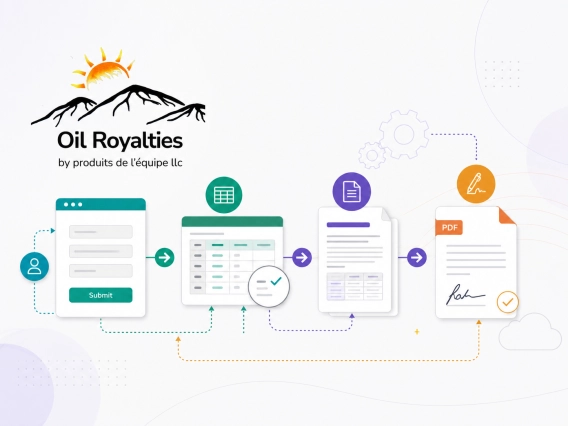
Learn how Oil-Royalties used Plumsail Documents with Jotform, Make, and Dropbox Sign to automate agreement generation and deliver pre-filled e-sign agreements.