Org Chart
Aug 08, 2024
How to Export Org Chart from Microsoft Teams
Learn how to effortlessly export Org Chart from Microsoft Teams, featuring Plumsail integration. Step-by-step guide for CSV, PDF, and PNG exports.

Filtered views in Plumsail Org Chart let you focus on what matters most. If you often need to filter Org Chart by department, team, location, or role — Views let you save these filters and switch between them with a single click.
In this article, we'll go over common use cases and show how to create and manage filtered views.
Further in the article:
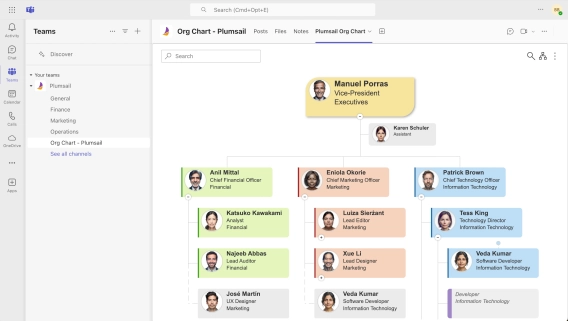
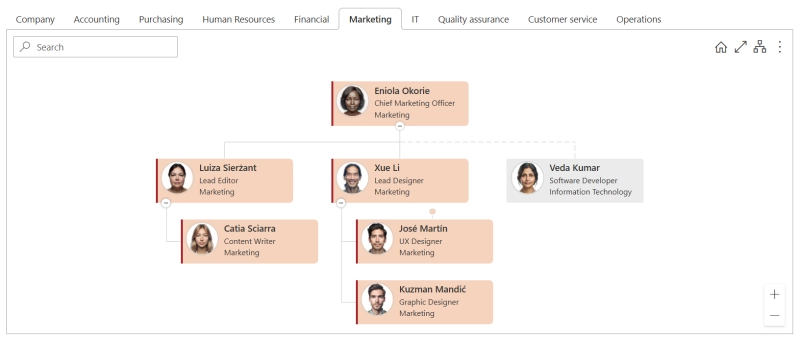
Views are saved filters that let you quickly switch between different perspectives of your organization. In the Org Chart, Views appear as tabs, each displaying a chart based on a starting employee and specific filtering conditions.
The key benefits of using Views are:
To create views, start by downloading Plumsail Org Chart for SharePoint and follow the installation guide. Then open the Org Chart configuration wizard and select your data source.
Let’s begin by creating a view for a specific department, and then add more views with different filtering conditions.
After selecting the data source, switch to the Views tab in the configuration wizard:
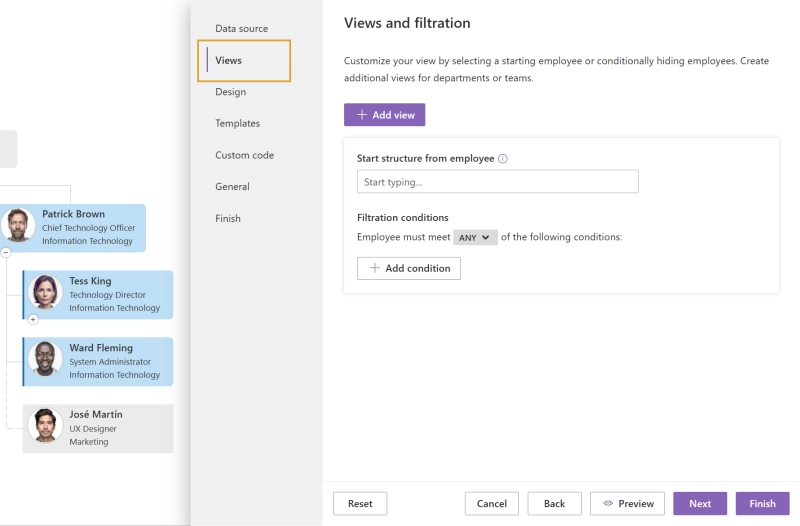
By default, there is one default view and no additional views. To add a view for specific department, follow the steps:
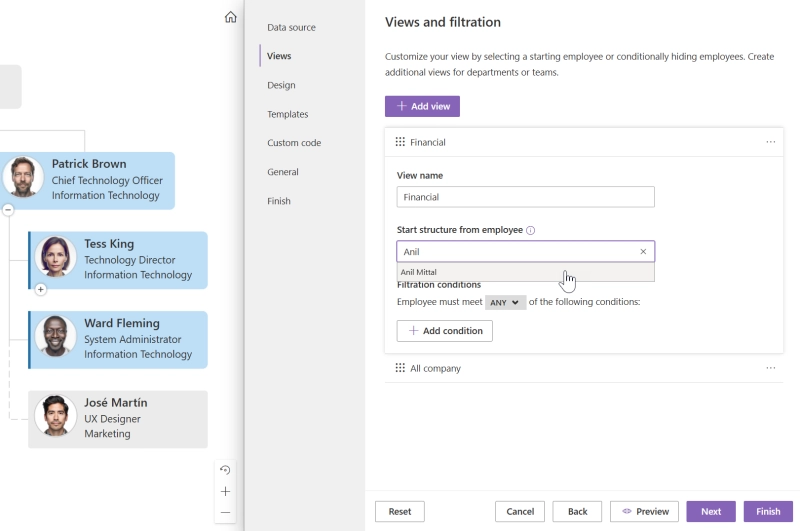
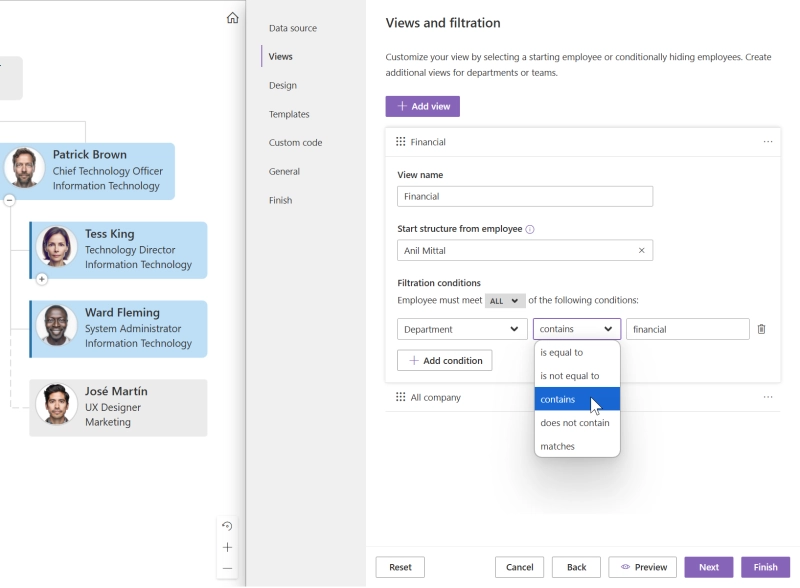
It is required to specify a root employee when using the filtration conditions. All subordinates must meet the conditions to appear, but the root employee is not subject to them.
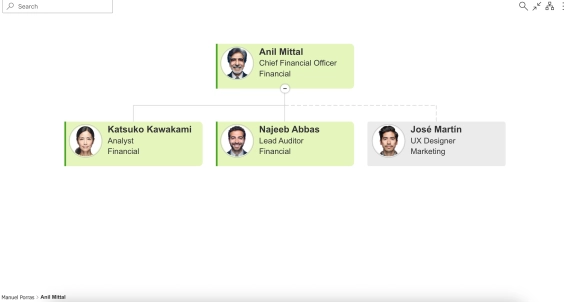
In this example, Org Chart checks if the Department field contains "financial" and starts the chart from Anil Mittal.
This is the result we have after applying the settings:
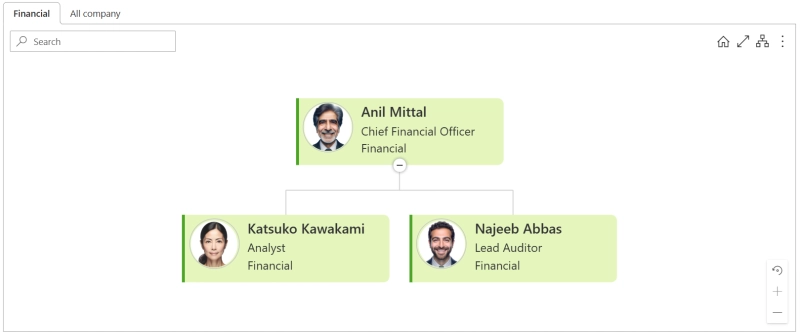
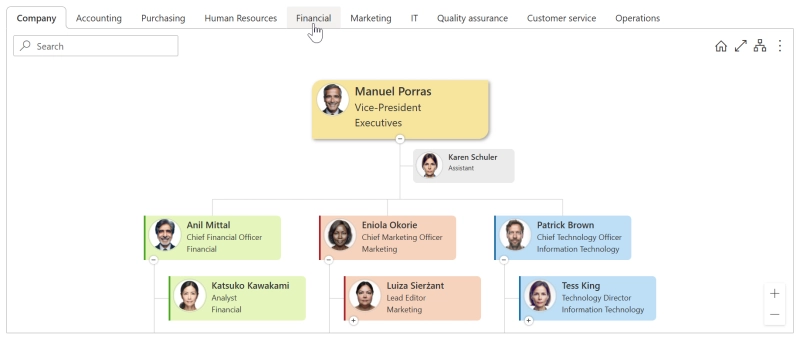
There are two tabs:
You can add more views with multiple conditions and specify whether employees must meet Any or All of them.
Let’s create a view showing only leads from the Marketing department. In this case the view settings look like this:
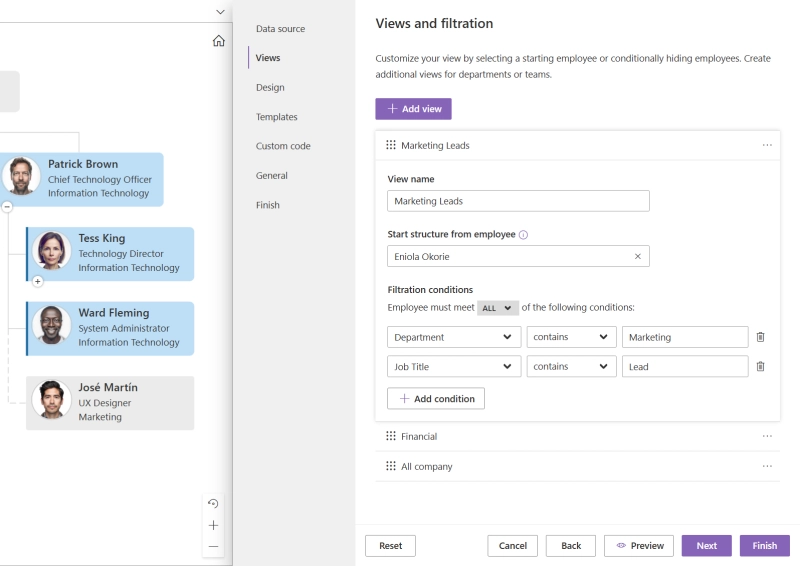
Now there are two conditions:
Department contains MarketingJob Title contains LeadWe also select the All parameter to get results when both conditions are met.
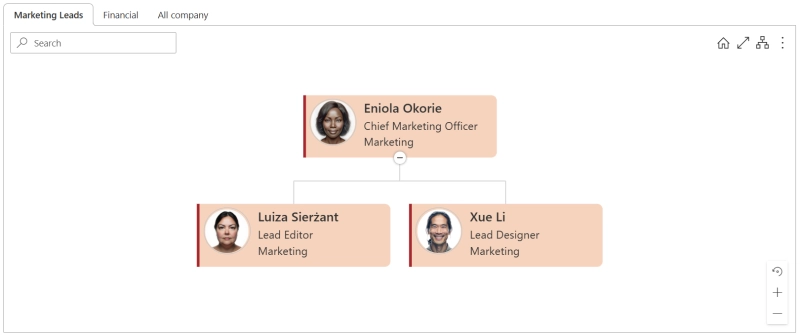
The rendered chart will be the following:
You can freely combine conditions to create more complex filtering options and customize the views. It's also possible to change the order of views in the web part. Check out the detailed explanation of the Views feature in the user guide.
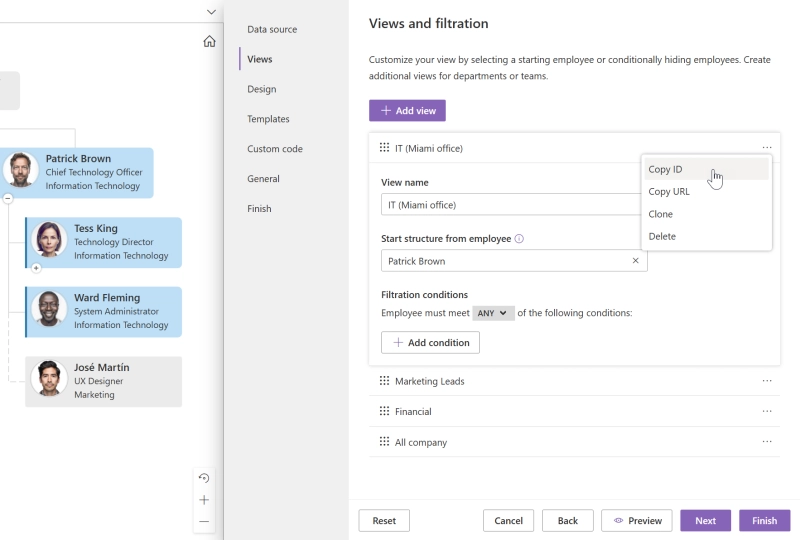
Let's say the company has several locations and we want to add a view with all employees from the Information Technology department who work at a specific location (e.g., Miami).
You can build more complex filtration rules using the JavaScript method
api.filtrationRules["{{viewID}}"] The steps are:
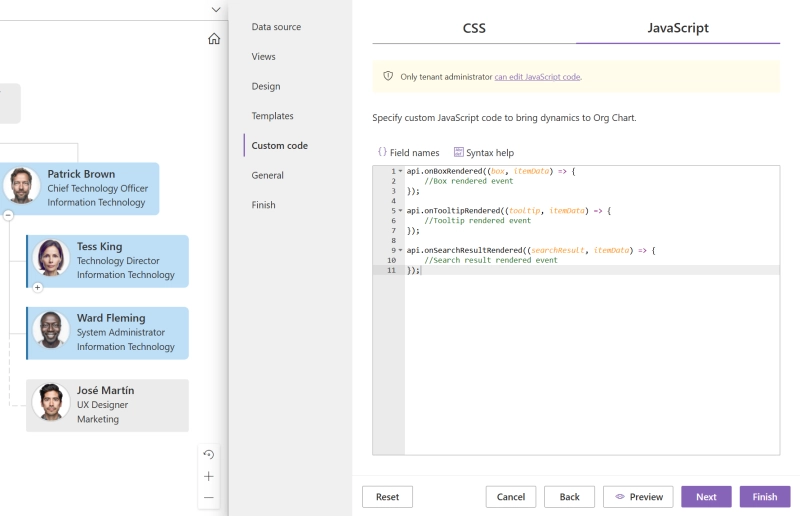
api.filtrationRules["aa87a150-0451-4c03-934a-017f19019a2d"] = (itemData) => {
    return itemData["Location"].contains("Miami") && itemData["Department"] == "Information Technology";
}
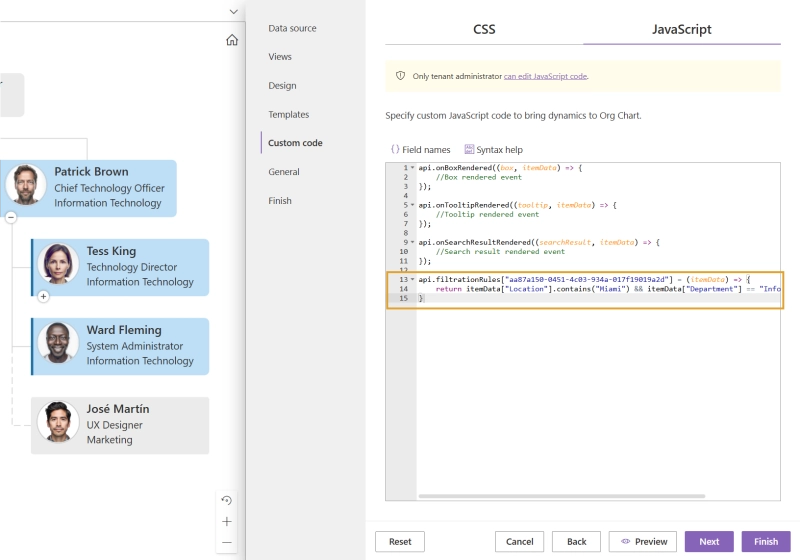
The JavaScript method returns true if the location contains "Miami" and the department is "Information Technology". Also, the changes are applied to a view with ID aa87a150-0451-4c03-934a-017f19019a2d, which was copied in the first step.
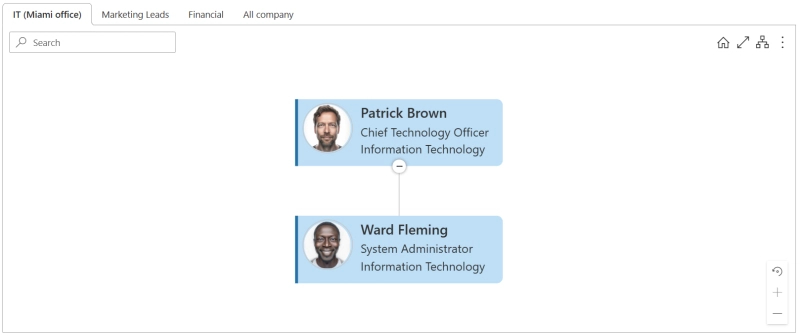
And we have the result. The tab IT (Miami office) shows all IT employees located in Miami:
Check out the full documentation for the JavaScript method in the Org Chart documentation.
Plumsail Org Chart offers powerful tools to create customized views. Whether you want to highlight specific departments, roles, locations, or teams, the flexible filtering options, combined with advanced JavaScript support, make it easy to build the exact view you need.
Download Plumsail Org Chart today and enjoy a one-month free trial!
Need a quick walkthrough? Schedule a 15-minute demo call with our specialist to discuss any questions.
Learn how to effortlessly export Org Chart from Microsoft Teams, featuring Plumsail integration. Step-by-step guide for CSV, PDF, and PNG exports.
Dotted line Org Chart. Learn how to display dotted line reporting in your org chart using different data sources with video tutorial included.
Learn how to create an org chart from Active Directory for Microsoft Teams and SharePoint with this step-by-step guide for easy setup and configuration.