
SharePoint Charts
Create rich animated, interactive charts based on SharePoint lists, libraries, or external data directly in the browser. Support of SharePoint 2019/2016/2013/2010 including Foundation and SharePoint Online in Office 365.

Aggregate, group, and filter data by current user, date, or any other parameters.
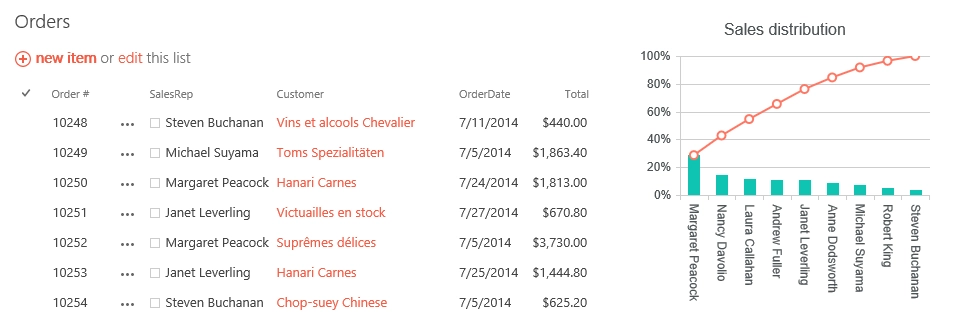
Choose from various chart types — Lines, Bars, Bullets, Pies, Scatters, Bubbles, Gauges, or Maps. Combine multiple ones in a single plot.
Use external data in your charts — currency rates, traffic, or weather with the help of JavaScript framework.
Refresh charts asynchronously with specified time intervals.
Display data from various sites within your web application on a single SharePoint page. It can be either classic SharePoint page or modern page in Microsoft 365.
Works perfectly on mobile devices!
